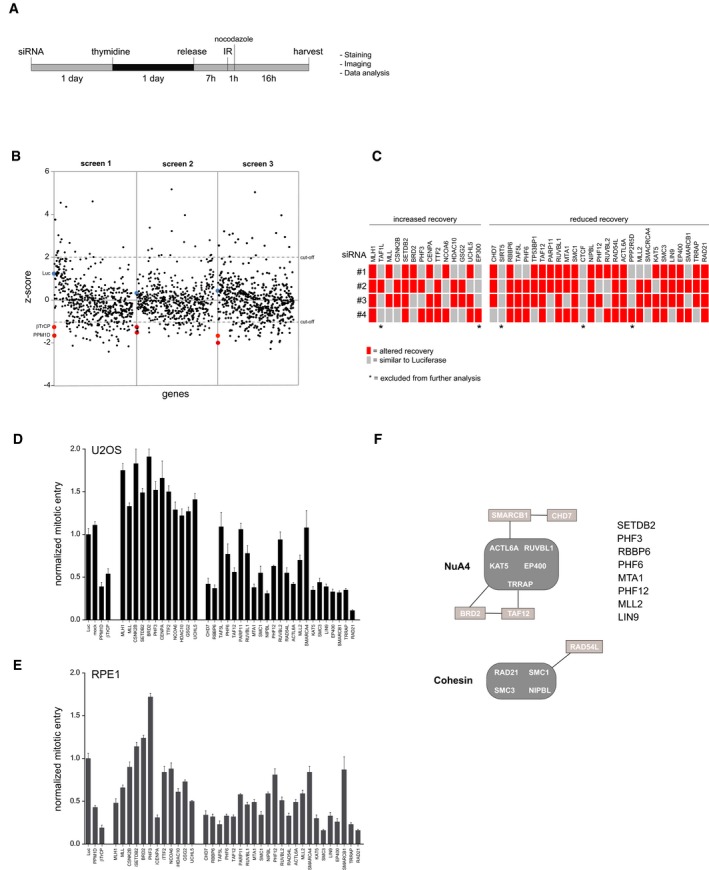
Figure 1. RNA interference‐based screen for G2 checkpoint recovery.

-
AExperimental setup used to screen for chromatin regulators involved in the IR‐induced G2 checkpoint response and recovery. Unless stated otherwise, 5 Gy of IR was used.
-
BResults of three independent microscopy‐based screens in U2OS cells. Knockdown of luciferase (blue) and the positive controls PPM1D and βTrCP (red) are indicated. A low/high Z‐score indicates less/more phospho‐histone H3 positive cells compared with the control, reflecting reduced/increased numbers of cells going into mitosis in the respective knockdowns after 5 Gy of IR.
-
CDeconvolution of the 41 primary hits in U2OS cells by four separate siRNA oligonucleotides. Gray represents a recovery value that is similar to the luciferase control (< 0.5 SD), and the red represents an altered recovery value (> 0.5 SD) in two independent experiments.
-
D, EU2OS cells (D) and RPE1 hTert immortalized primary epithelial cells (E) were transfected with siRNA oligos targeting the hits in a similar setup as described in A), but now analyzed for mitotic entry by MPM2 and PI staining by flow cytometry. For normalization, see Materials and Methods. Error bars represent the SEM of three independent experiments.
-
FGraphical explanation of the known interactions between the identified hits through STRING pathway analysis.
