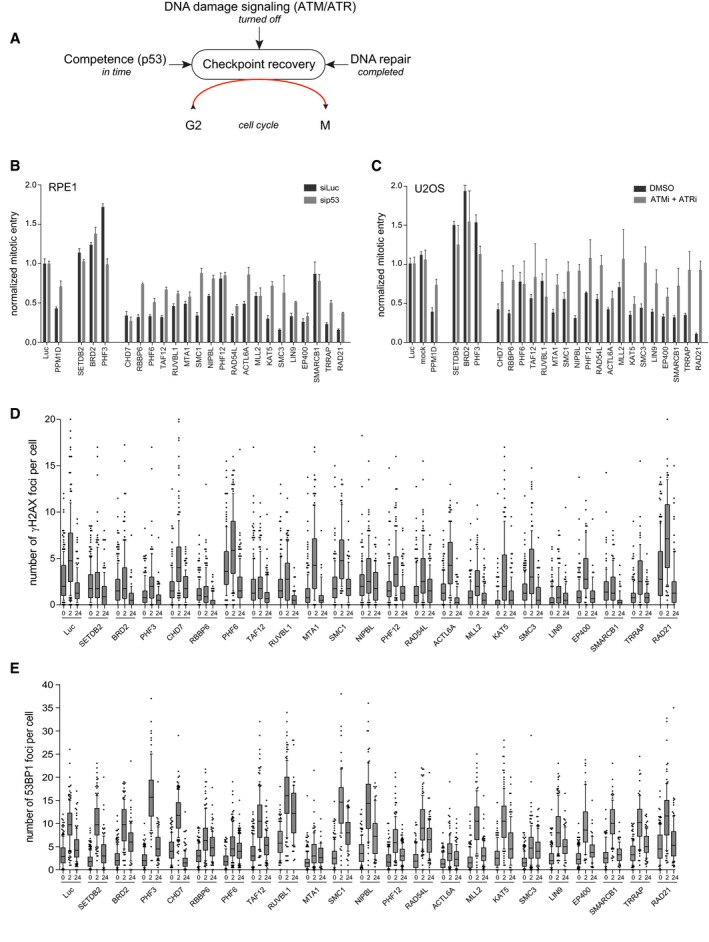
Figure 2. Classification of the screen hits.

-
AOverview of the cellular mechanisms that influence DNA damage‐induced G2 checkpoint recovery.
-
BRPE1 cells were depleted for p53 in combination with the indicated proteins by siRNA, in conditions used for the primary screen (2 Gy of IR). Mitotic entry was analyzed by MPM2 and PI staining by flow cytometry. For normalization, see Materials and Methods. Error bars represent the SEM of three independent experiments.
-
CU2OS cells were transfected with the indicated siRNA oligonucleotides in a setup similar to the primary screen, but with 10 Gy of IR and in the presence of ATM and ATR inhibitors. Mitotic entry was analyzed by MPM2 and PI staining by flow cytometry. For normalization, see Materials and Methods. Error bars represent the SEM of three independent experiments.
-
D, EU2OS cells were transfected with the indicated siRNA oligos using the protocol of the primary screen and fixed for immunofluorescence after 0, 2, and 24 h after 5 Gy IR. Samples were stained with antibodies for γH2AX (D) or 53BP1 (E) and analyzed through automated confocal microscopy and specifically developed image analysis software. From one experiment, two to four separate images with a total of at least 100 cells were analyzed for each knockdown. Shown is the number of γH2AX (D) and 53BP1 (E) foci per cell. In the box plots, the median with the first and third quartile is indicated, and the whiskers are drawn down to the 10th percentile and up to the 90th.
