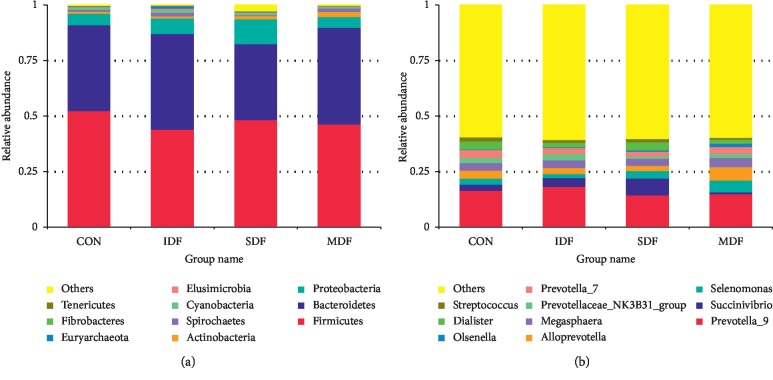
Figure 2.
The relative abundances of top 10 phyla (a) and genera (b) in different groups (n=6). Each bar represents the average relative abundance of each bacterial taxon within a group. The top 10 most abundant taxa are shown. CON, control; IDF, 1% insoluble fiber; SDF, 1% soluble fiber; MDF, 0.5% insoluble fiber +0.5% soluble fiber.

