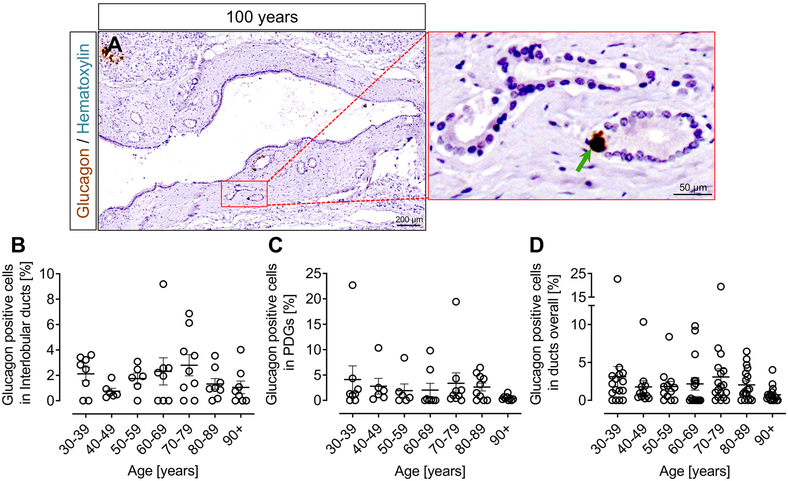
Figure 4. Glucagon positive cells in ducts according to age in lean non-diabetic subjects.
Representative sections of human pancreas stained for glucagon (DAB) and counterstained with hematoxylin to show glucagon expression in ducts in human (100 years) pancreas (A). Inset, higher power area of glucagon staining in pancreatic duct glands (PDGs) indicated by red square in the lower power image. The green arrow indicates glucagon immunoreactivity in a PDG. The percentage of glucagon positive cells in large ducts (B), PDGs (C) and in the combined ductal epithelial compartment (D). The percentage of glucagon positive cells present within the ductal epithelial compartment was unchanged across the adult lifespan. Scale bars, 200μm for lower power image and 50μm for higher power image.

