Fig. 3.

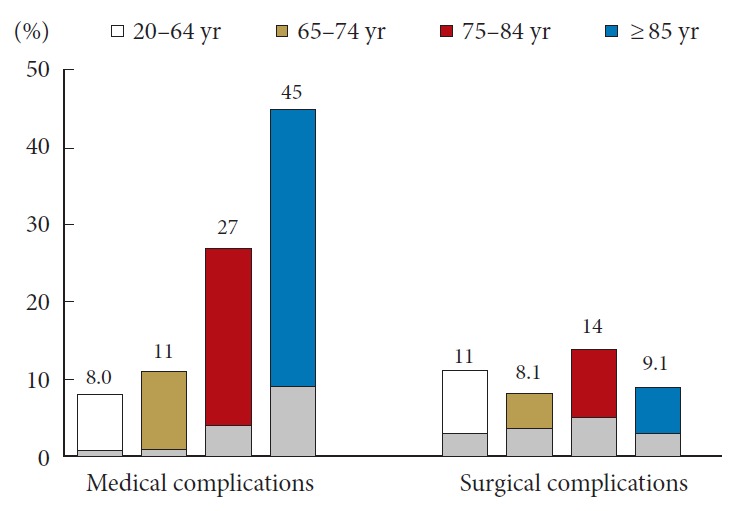
The rates of complications. The values on the y-axis represent the complicated surgeries/total surgeries. Gray bars indicate the rates of major complications.

The rates of complications. The values on the y-axis represent the complicated surgeries/total surgeries. Gray bars indicate the rates of major complications.