Figure 2.
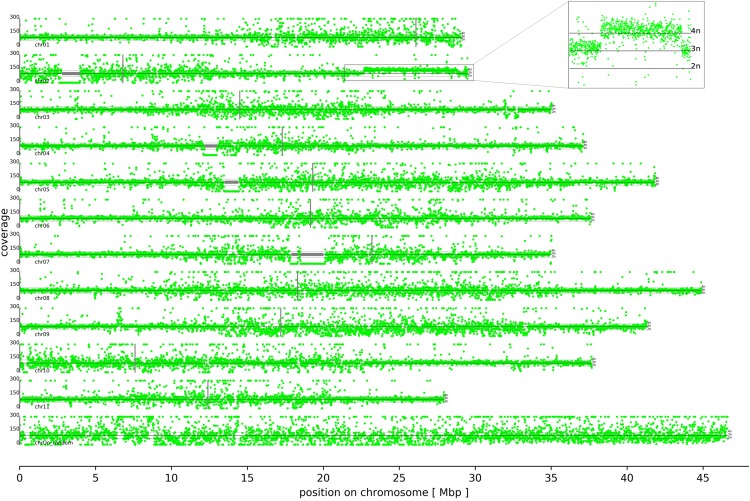
Coverage distribution. Chromosomes are ordered by increasing number with the north end on the left hand side. Centromere positions (D’Hont et al. 2012) are indicated by thin vertical gray lines. Mapping of M. acuminata Dwarf Cavendish reads against the DH Pahang v2 reference sequence assembly revealed a 6.2 Mbp tetraploid region on the long arm of chromosome 2 in Dwarf Cavendish (see enlarged box in the upper right). Apparent large scale deletions, indicated by regions with almost zero coverage, are technical artifacts caused by large stretches of ambiguous bases (Ns) in the Pahang assembly that cannot be covered by reads; these artifacts are marked with horizontal gray lines. Plots with higher per chromosome resolution data are presented in Supplementary File S1.

