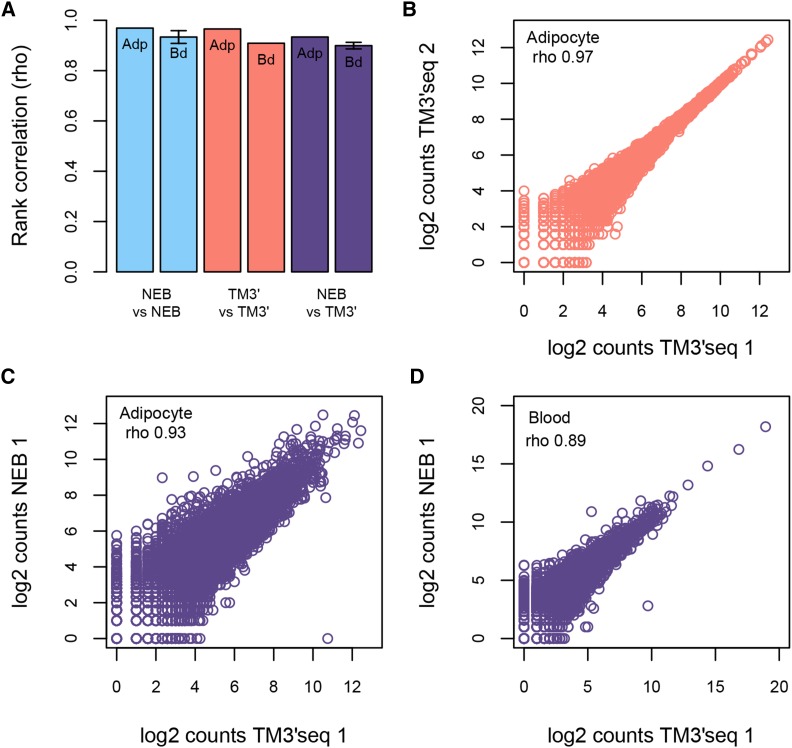
Figure 2.
Performance of the TM3′seq method based on the correlation between RNA-seq library replicates. Gene counts per sample were compared between TM3′seq replicates (red), NEB replicates (blue), and between NEB and TM3′seq replicates (purple). Each method has three replicates per tissue (blood – Bd, and adipocytes - Adp). Each replicate corresponds to 1M uniquely mapped RNA-seq reads that were assigned to the set of 20612 protein-coding genes in the GRCh38 assembly of the human genome. TM3′seq libraries were amplified for 12 PCR cycles. Panel (a) shows the average correlation between NEB replicates (n = 3), TM3′seq replicates (n = 3), and NEB vs. TM3′seq samples (n = 9). The whiskers indicate two standard deviations from the mean. In most of the groups the standard deviation is too small to be plotted. Panels (b-d) show examples of the correlation between replicates. A comparison between mapping parameters of both methods can be found in Figure S1.

