Figure 3.
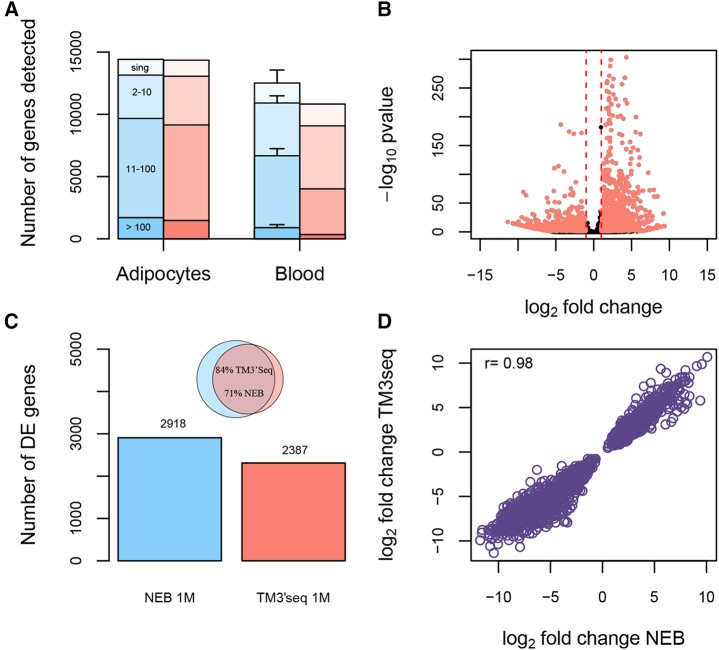
Performance of TM3′seq method based on differential expression analysis between blood and adipocytes. Three replicates per tissue were used. Each replicate corresponds to 1M uniquely mapped RNA-seq reads per sample assigned to the set of 20612 protein-coding genes in the GRCh38 assembly of the human genome. The performance of TM3′seq (red) is compared to NEB@Next Ultra (blue). TM3′seq libraries were amplified for 12 PCR cycles. (a) Number of genes detected with each method. Genes are clustered by abundance: singletons (sing), 2-10 reads, 11-100 reads, and > 100 reads. The average number of genes in three replicates is shown; the whiskers represent two standard deviations; in most samples std is too small to be plotted. (b) Volcano plot showing the significance as a factor of log fold change (lfc) for each gene (dot) in TM3′seq. Significant genes with lfc > 1 are highlighted in red. (c) Differentially expressed genes in each method (Bonferroni p-value <0.05). The inset shows the overlap between differentially expressed genes detected by NEB and TM3′seq at 1M reads. (d) Correlation between the effect sizes (lfc) of the 2082 genes that overlap between TM3′seq and NEB 1M reads.

