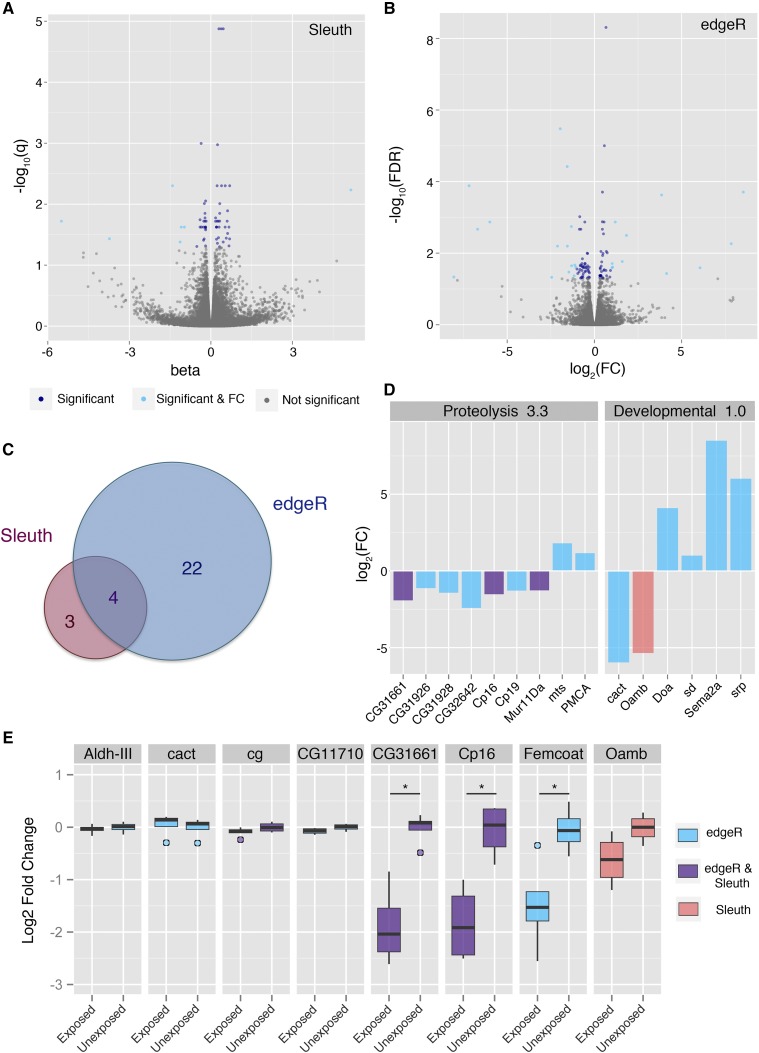
Figure 3.
Transcriptional changes in ovary tissues. RNA sequencing was performed on ovary tissues and analyzed using two different methods: Volcano plots visualize differential gene expression for Kallisto/Slueth (A), and CLC/edgeR (B). Light blue points are differentially expressed transcripts, having both a significant test statistic as well as a log2 fold change of 2 or greater. Dark blue points are transcripts with a significant test statistic but falling below the fold change threshold. Venn-diagram displays the overlap between differentially expressed transcripts for the two analysis pipelines (C). DAVID functional annotation clustering is shown for the two most enriched clusters. Coloring indicates the pipeline that categorized the gene as differentially expressed (D). qPCR was performed to validate gene expression changes observed in sequencing (E). Asterisk indicates a p-value of <0.05.

