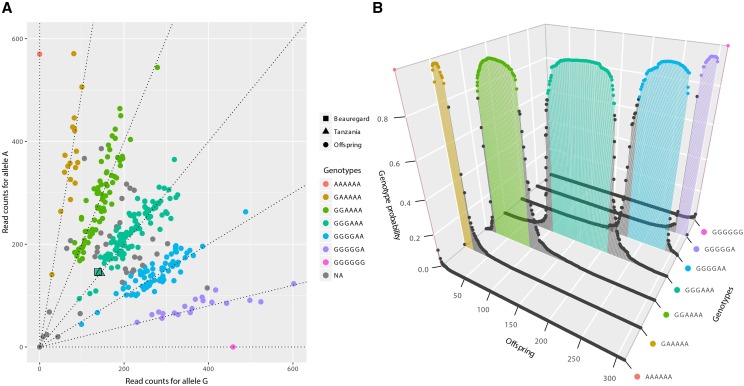
Figure 1.
Example of genotype call of SNP Tf_S1_30010438. (A) Scatter plot of the read counts for the two allelic variants A and G. The axes represent the read counts of both allelic variants. Squared and triangle dots represent parents ‘Beauregard’ and ‘Tanzania’ respectively, and regular dots represent the offspring. Dashed lines indicate seven possible dosages in a hexaploid individual. The different colors indicate the dosages assigned to the individuals by SuperMASSA. The low number of individuals observed between genotypic classes (gray dots, with genotype probability smaller than 0.8), outlines a data set with low noise, producing a clear classification. The genotypes of both parents were estimated as three doses of the allelic variant A three doses of G. The genotype calling model also considered the expected Mendelian segregation ratio, which under random chromosome pairing is 1:18:99:164:99:18:1. (B) Inferred probability distribution of genotypes for each individual in the offspring. The colored dots correspond to individuals with the same genotypic classes in panel A. Loci where the highest posterior probability was smaller than 0.8 were assigned as missing data (gray dots).

