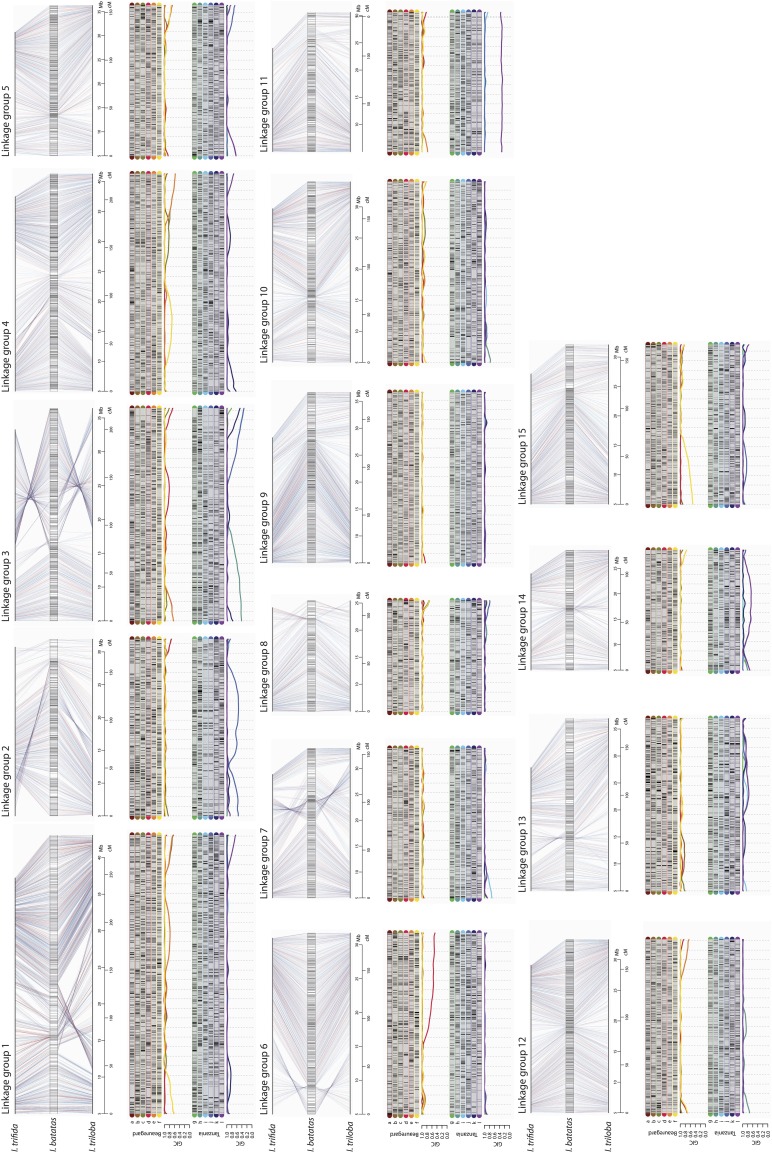
Figure 2.
Sweetpotato genetic map. For each of the 15 LGs, we present the I. batatas genetic map with its SNPs anchored in both diploid reference genomes. Blue lines connecting the map and reference genomes indicate SNPs shared between I. trifida and I. triloba reference genomes and red lines indicate private SNPs. Above each map, we present a graphical representation of the parental linkage phase configuration of the homology groups for parents ‘Beauregard’ and ‘Tanzania’. Black and gray rectangles indicate two allelic variants in each marker in all 12 parental homologs (6 in ‘Beauregard’ and 6 in ‘Tanzania’). The Genotypic Information Content (GIC), is presented below each homology group.

