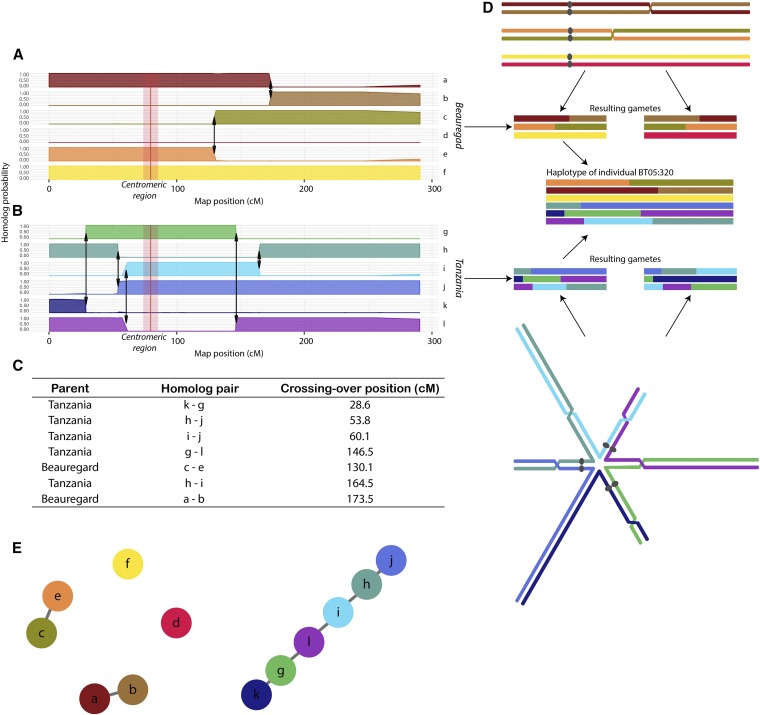
Figure 3.
Example of haplotype reconstruction and distribution of meiotic configurations for individual BT05.320, linkage group 1. A) and B) Probability profiles for 12 homologs indicating the segments inherited from parents ‘Beauregard’ and ‘Tanzania’, respectively. The red line indicates the approximated centromeric region obtained using the I. trifida reference genome. The arrows indicate recombination points; C) Recombination signature table indicating the homolog pairs involved in each crossing-over and their position in the map; D) Possible meiotic configuration that originated gametes for individual BT05.320 in ‘Beauregard’ and ‘Tanzania’ and resulting gamete. Each chromosome is represented by one chromatid; E) Representation of the meiotic results as a graph: nodes represent the homologs and the edges represent recombination events between them.

