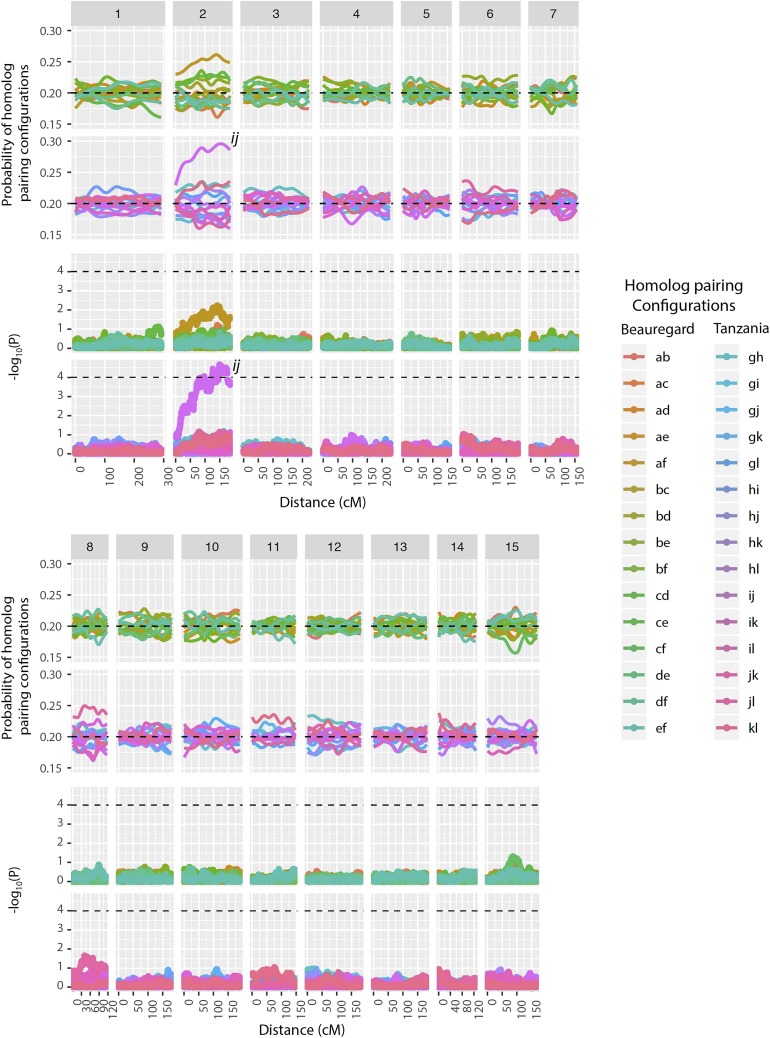
Figure 5.
Probability profiles for 15 homolog pairs in parents ‘Beauregard’ and ‘Tanzania’ across 15 LGs. The dashed lines in the probability profiles indicate the pairing probability expected under random pairing (). The lower panels indicate of a independence test for all possible homolog pairs. Dashed lines indicate . Homologs i and j presented a low, but significant preferential pairing in LG 2.

