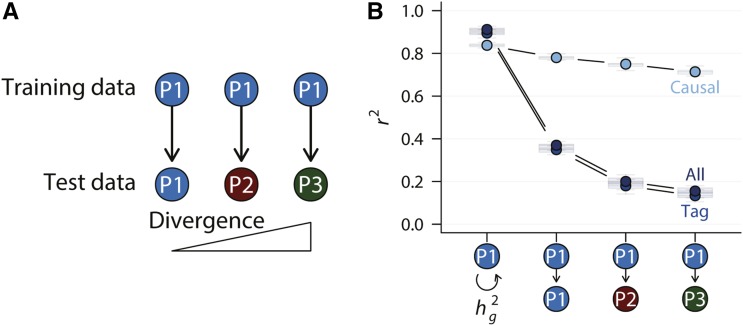
Figure 3.
Polygenic prediction under additive genetic architecture. (A) Polygenic prediction was performed according to the diagram, where the model was trained in population P1 and tested in populations P1, P2, and P3 at increasing divergence. (B) Prediction accuracy was plotted according to the training – test population relationships. For comparison, genomic heritability was also plotted along side. Only the additive genetic architecture was considered in this plot.

