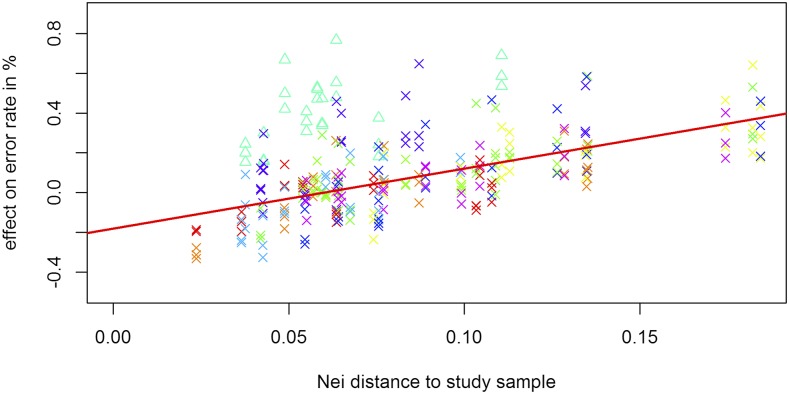
Figure 9.
Effect of the inclusion of a single subpopulation in the reference panel based on their genetic distance to the dataset for the chicken diversity panel. Colors according to the subpopulation used as the real dataset in Supplementary Figure S1. For a detailed list of subpopulation assignment we refer to Supplementary Table S8. Subpopulation 6 (including wild types - turquoise ) is ignored in the regression.

