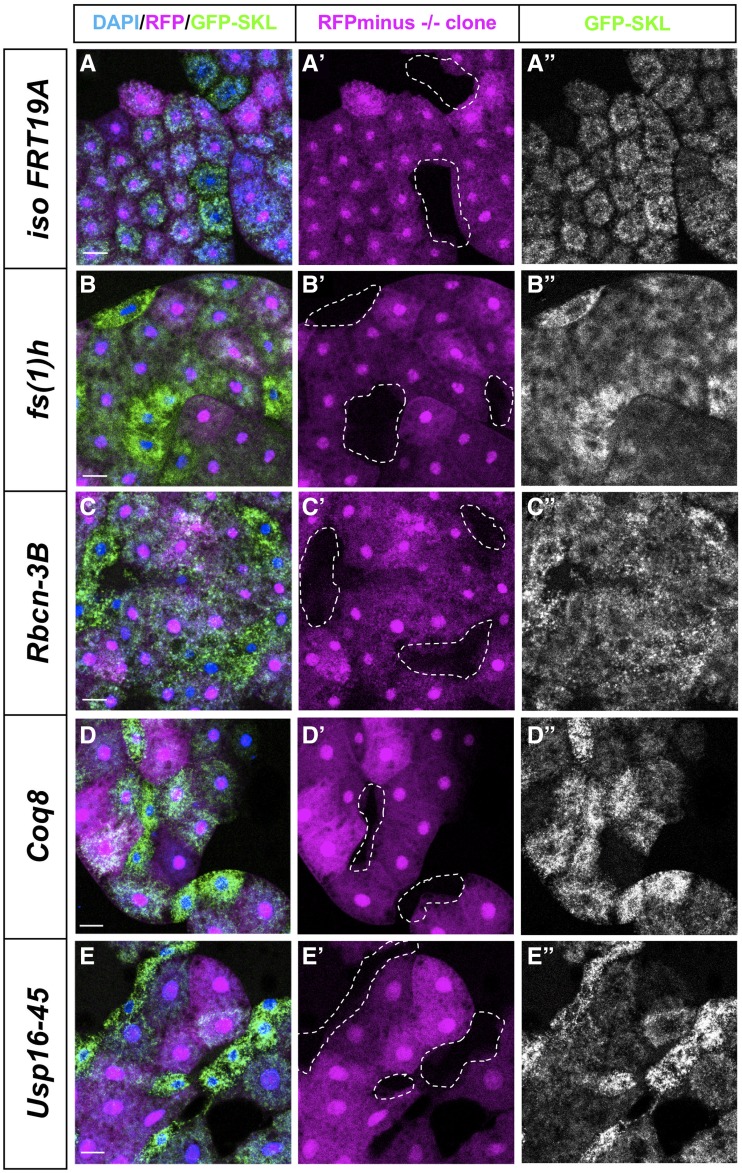
Figure 2.
Peroxisomal morphological phenotypes observed in-vivo. Third instar fat body clones are shown in merge DAPI (in blue) / RFP (magenta) / GFP-SKL (green) in first from left column. Homozygous mutant cells that lack RFP are shown with dotted lines in the middle column and the right most column shows the same cells showing the GFP-SKL signal. The images in A-A”- iso FRT19A clones are clones of the non-mutagenized chromosome and serve as negative controls. Images of some of the strong hits are shown in panels B-E” as fs(1)h clones (from B-B”), Rbcn-3B clones (from C-C”), Coq8 clones (from D-D”) and Usp16-45 clones (from E-E”). Scale bars represent 50μm. Images are taken on Zeiss710-LSM microscope with 10X objective of NA 0.3 with 8 bit depth and 2200x2200 resolution.

