Figure 3.
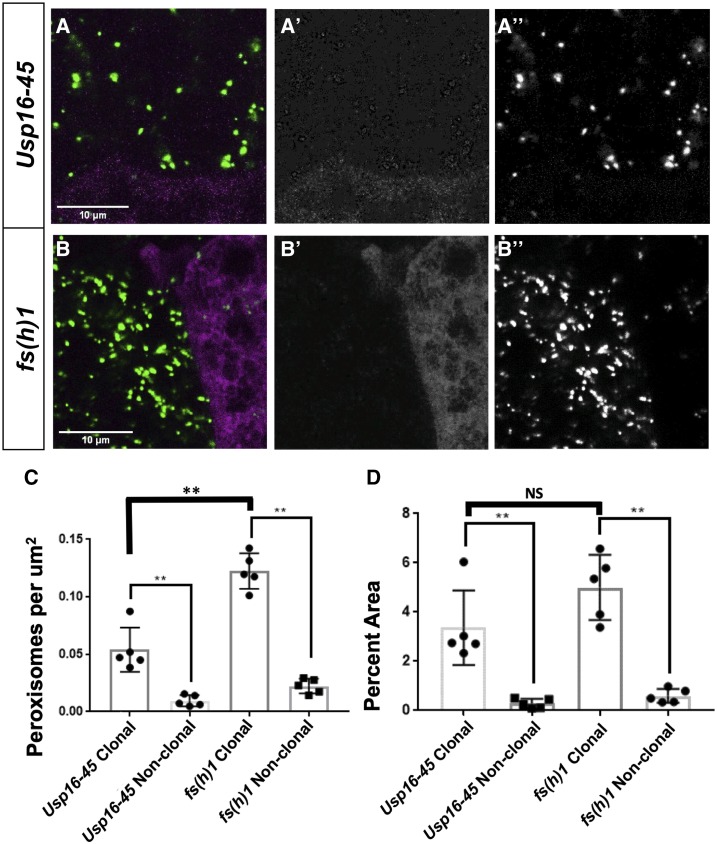
Peroxisomal morphological quantification. A. Higher magnification images of fat bodies of Usp16-45 Fig. 3A-A’’ were taken on Zeiss710-LSM microscope with 63X objective of NA 1.4 with 16 bit depth and 512x512 resolution. The scale bars noted in the image are 10μm. Note A is the image shown in Figure 1C’ to illustrate the Category A phenotype, and A’ is the RFP channel while A’’ is the GFP channel. B. Higher magnification images of fat bodies of fs(h)1 Fig 3B-B’’ were taken on Zeiss710-LSM microscope with 63X objective of NA 1.4 with 16 bit depth and 512x512 resolution. The scale bars noted in the image are 10μm. B is the image shown in Figure 1C’’to illustrate the Category B phenotype, and B’ is the RFP channel while B’’is the GFP channel. C. Quantification of number of peroxisomes present per μm2 of Clonal and non-clonal area. This data represents the number of peroxisomes present per μm2 of clonal/non-clonal area. Peroxisomes from five different stacks were counted with ImageJ and then divided with the total clonal/non-clonal area in that individual stack to get these data points. D. Quantification of percent area of total peroxisomes. The areas covered by peroxisomes in clonal as well as non-clonal regions from five different stacks were counted with ImageJ. The total of those peroxisomal areas in the same stack is divided by clonal/non-clonal area as shown in A’ and B’ of the same stack. The percent value of this is counted as one data point.

