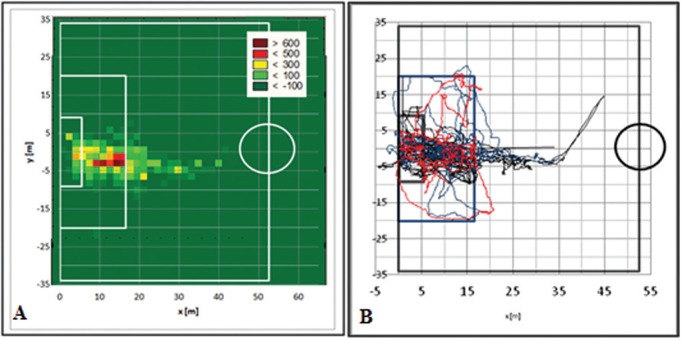
FIG. 3.
The goalkeepers’ movements in several zones of the pitch during the matches analysed: (A) goalkeepers’ sectors with action frequencies represented in pseudo-colour to discriminate the target of the actions <100/> 600 (all games averaged); (B) diagram based on the goalkeepers’ movements in one half of a match (a sample).

