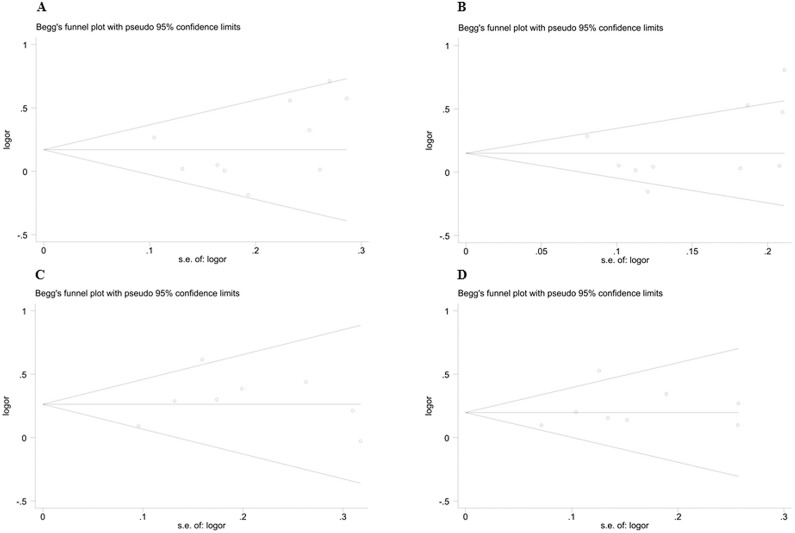
FIG. 4.
Begg’s funnel plot for eligible studies of association between PPARGC1A Gly482Ser polymorphism and athletic performance. (A) Homozygotes Gly/Gly vs. Gly/Ser+Ser/Ser for endurance performance; (B) Allele Gly vs. Ser for endurance performance; (C) Homozygotes Gly/Gly vs. Gly/Ser+Ser/Ser for power performance; (D) Allele Gly vs. Ser for power performance. OR= odds ratio.

