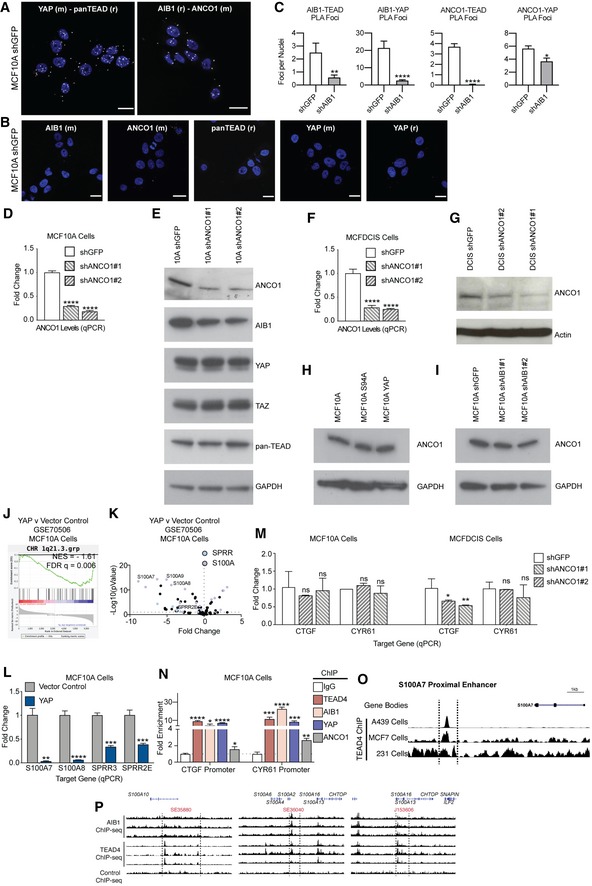
Positive control PLA, showing foci (white foci, falsely colored 594 nm signal) of interaction between YAP‐TEAD and AIB1‐ANCO1. Representative image; scale bars shown indicate 25 μm.
Single antibody negative PLA controls showing baseline signal in MCF10A shGFP (control) cells. Scale bars shown indicate 25 μm.
PLA foci are significantly reduced between ANCO1‐TEAD, ANCO1‐YAP, AIB1‐TEAD, and AIB1‐YAP following AIB1 knockdown. Quantification of proximity ligation assays shown in Fig
2A.
Levels of endogenous ANCO1 in MCF10A cells following knockdown of ANCO1; levels were assessed by RT–qPCR.
Levels of AIB1, YAP, TAZ, and TEADs are unaffected by ANCO1 depletion. Immunoblot of MCF10A cells following knockdown of ANCO1.
Levels of endogenous ANCO1 in MCFDCIS cells following infection of shANCO1; levels were assessed by RT–qPCR.
Immunoblot of MCFDCIS cells following knockdown of ANCO1.
Levels of ANCO1 are not changed by overexpression of YAP or YAP S94A. Immunoblot of ANCO1 in MCF10A cells following overexpression.
Levels of ANCO1 are not changed by AIB1 knockdown. Immunoblot of ANCO1 in MCF10A cells following AIB1 knockdown.
1q21.3 genes are suppressed by YAP overexpression relative to vector control. Gene set enrichment analysis of RNA‐seq in MCF10A cells overexpressing YAP or empty vector (
GSE70506).
Genes regulated by YAP overexpression on the 1q21.3 locus. Volcano plot of 1q21.3 genes with indicated S100A and SPRR family genes from
GSE70506.
YAP represses 1q21.3 localized genes. Levels of endogenous S100 and SPPR genes in MCF10A cell lines following overexpression of YAP or vector control; levels were assessed by RT–qPCR.
Levels of endogenous TEAD targets in MCF10A and MCFDCIS cell lines following infection of shANCO1; levels were assessed by RT–qPCR.
ANCO1 is moderately enriched at CTGF and CYR61 promoters; in contrast, AIB1, TEAD4, and YAP are robustly recruited to these promoters. Chromatin immunoprecipitation (ChIP) performed in MCF10A cells. Levels of precipitated chromatin assessed by qPCR.
TEAD is engaged at
S100A7 proximal enhancer region within 1q21.3. Analysis of TEAD4 ChIP‐seq in MDA‐MB‐231(
GSE66081), MCF7, and A549 Cells (
GSE32465) at 1q21.3.
AIB1 and TEAD are detected at superenhancer sites in normal mammary cells that were identified in other cancer cell lines. Analysis of AIB1 and TEAD4 ChIP‐seq peaks at 1q21.3 in MCF10A cells.
‐test was used for the statistical analysis in panels (C, D, F, L, M, and N); data represent the means ± SD from at least three biological replicates (*
< 0.0001, ns = not significant). GSEA enrichment score and FDR used in panel (J). RNA‐sequencing statistics in panel (K) were calculated by EdgeR with Benjamini–Hochberg multiple test correction in R.

