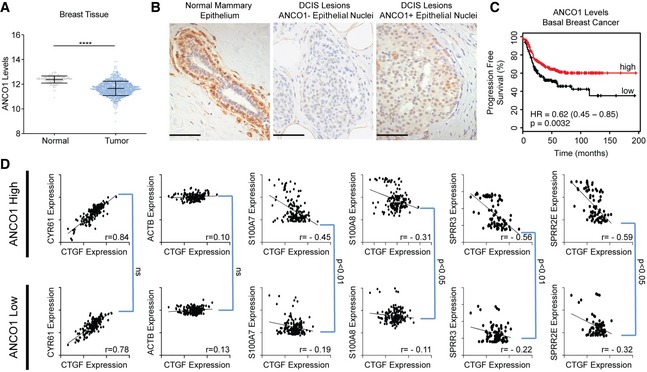
ANCO1 levels decrease in breast cancer. ANCO1 mRNA expression from normal tissue (GTEX) and tumor (TCGA) for breast samples.
Representative IHC images of ANCO1 staining in normal human breast and DCIS lesions. DCIS lesions can be stratified to either ANCO1‐negative (center panel) or ANCO1‐positive (right panel). Scale bar = 50 μm.
High ANCO1 levels are a good prognostic indicator in basal breast cancer in patients. KM plot showing progression free survival in patients with stratified ANCO1 expression. n = 360 patients.
Patient breast tumor samples with reduced ANCO1 levels have high expression of 1q21.3 genes, without altered AIB1‐YAP co‐activated gene expression. Dot plots showing TCGA Pan‐Cancer data accessed via Xenabroswer. Patients were stratified to high or low expression of ANCO1 by median expression.
Data information: Student's
t‐test was used for the statistical analysis in panel (A) (
n = 179 in normal group and
n = 1,213 in tumor group). KmPlot statistics were calculated by KMplotter in panel (C) (
n = 360 patients). In panel (D), r values were calculated for each correlation (for individual correlations,
P < 0.001), and
P values were determined for linear regression between groups (
n > 150 patients). ****
P < 0.0001.
Source data are available online for this figure.

