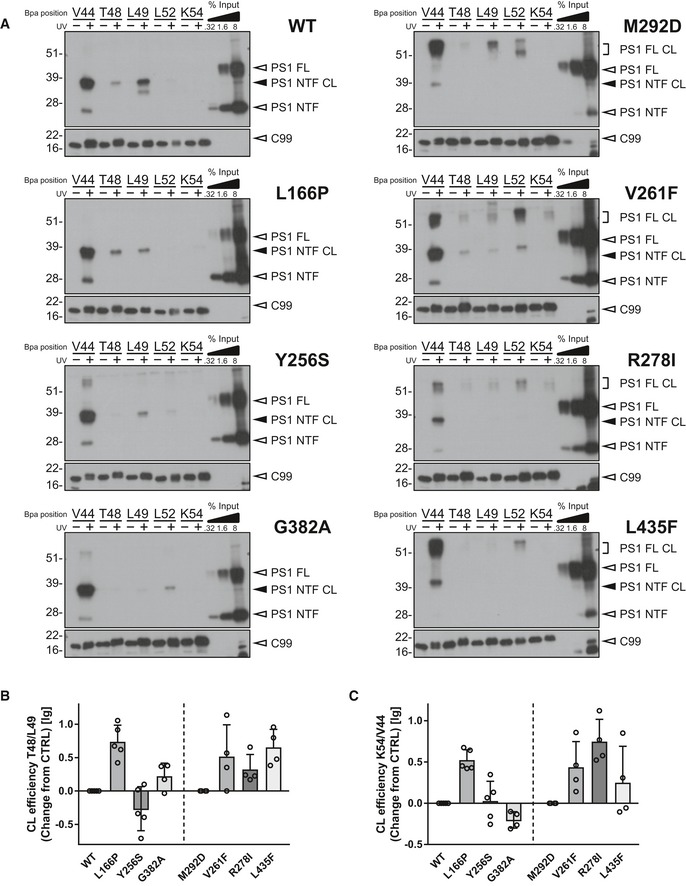
Figure 2. Aβ43‐generating PS1 FAD mutants show altered C99 interactions.

- Immunoblot analysis of C99–PS1 NTF or full‐length (FL) crosslinks (CL) of the indicated mutants. Samples that were not UV‐irradiated were loaded to control for specificity.
- Changes in the ratio of crosslink efficiencies at positions T48 and L49 compared to corresponding controls (n = 4–5 biological replicates).
- Changes in the ratio of crosslink efficiencies at positions K54 and V44 compared to corresponding controls (n = 4–5 biological replicates).
