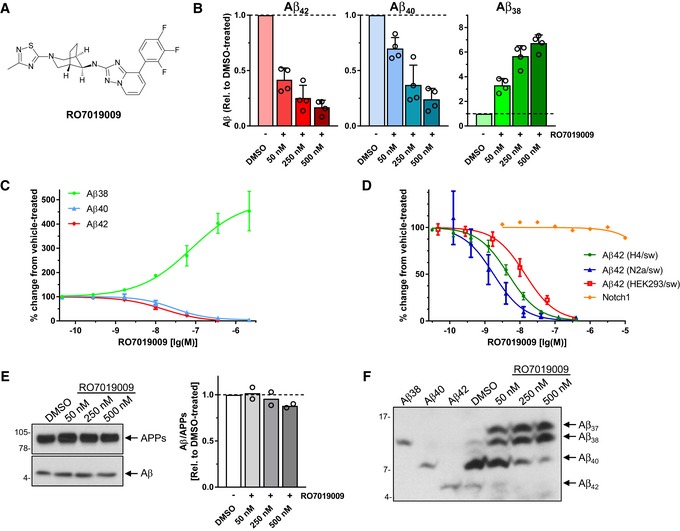
Figure 3. Characterization of RO7019009.

- Structure of RO7019009.
- ELISA of Aβ species in conditioned medium of HEK293/sw cells treated with RO7019009 or vehicle (DMSO). Aβ levels are shown relative to DMSO vehicle control (n = 4 biological replicates).
- Dose–response curve of RO7019009 in HEK293/sw cells measured using the MSD sandwich immunoassay (n = 3 biological replicates).
- Dose–response curves for inhibition of Aβ42 generation and Notch cleavage by RO7019009 in different cell lines. Comparison of in vitro potencies for Aβ42 inhibition in HEK293/sw cells, IC50 = 14 nM (n = 3) (as in (C)) with those in H4/sw cells, IC50 = 5 nM (n = 7) and N2a/sw cells, IC50 = 2 nM (n = 6) together with that of Notch cleavage inhibition in a HEK293‐based Notch1 luciferase reporter cell line, IC50 > 10 µM (n = 2) (all n numbers represent biological replicates).
- Left panel: Immunoblot analysis of total Aβ in conditioned media of HEK293/sw cells treated with RO7019009 or vehicle (DMSO). Total APPs levels were analyzed to control for normal APP secretion and equal sample loading. Right panel: Quantification of relative Aβ amounts in (E) (n = 2 biological replicates).
- Immunoblot analysis of Aβ species in conditioned media of RO7019009‐treated HEK293/sw cells after separation by Tris–Bicine urea SDS–PAGE; synthetic Aβ peptides were loaded as size markers.
