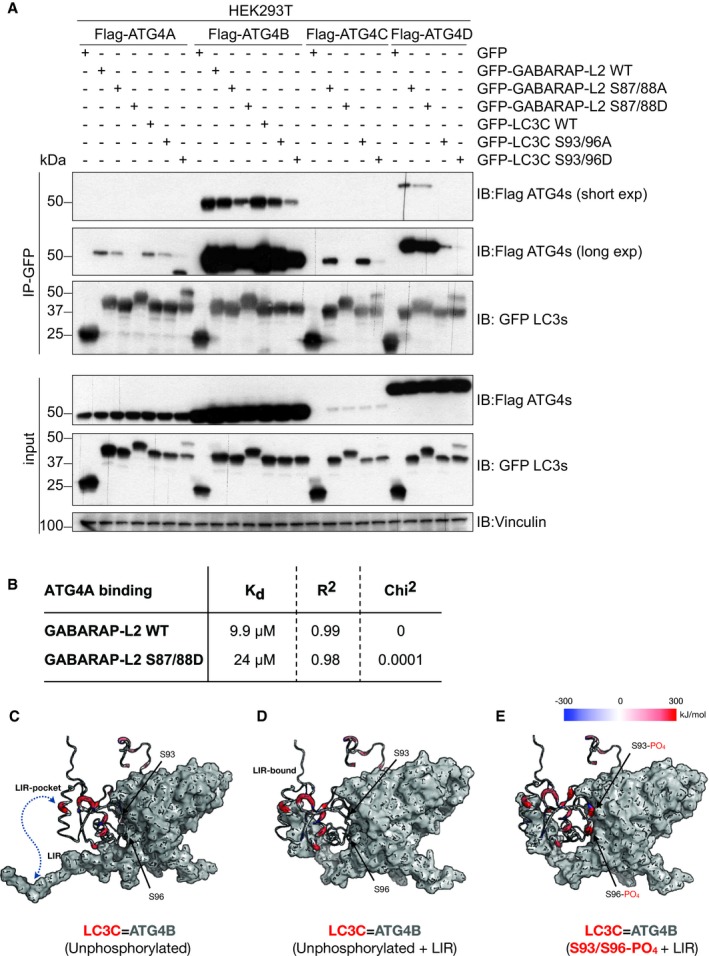
Figure EV2. Phosphorylation of S93 and S96 of LC3C affects ATGB binding.

-
ASDS–PAGE and Western blot of HEK293T cell lysates and GFP immunoprecipitations. Cells were transfected with Flag‐tagged ATG4A, ATG4B, ATG4C, or ATG4D and GFP‐tagged LC3C or GABARAP‐L2 WT or mutants and lysates used for GFP IPs. S93/96D mutation of LC3C and S87/88D mutation of GABARAP‐L2 impede binding to ATG4A, ATG4B, ATG4C, and ATG4D.
-
BBio‐Layer Interferometry measurement of GST‐ATG4A binding to His‐GABARAP‐L2 WT and S87/88D.
-
C–E(C) WT LC3C‐ATG4B complex (D) with additional LIR interactions and (E) with phosphorylated LC3C residues (S93 and S96) subjected to MD simulations and binding free energy computations using MM‐PBSA (see Materials and Methods) approach. A residue‐wise decomposition of the total binding free energy mapped onto the LC3C structure displays locally favorable (blue), neutral (white), and unfavorable (red) residue interaction with ATG4B (gray surface). S93 and S96 positions in WT complexes contribute favorably (blue), whereas in the phosphorylated complex they contribute unfavorably (red) toward complex formation. The thickness of the backbone scales linearly with the binding energy of LC3C‐ATG4B complexes.
Source data are available online for this figure.
