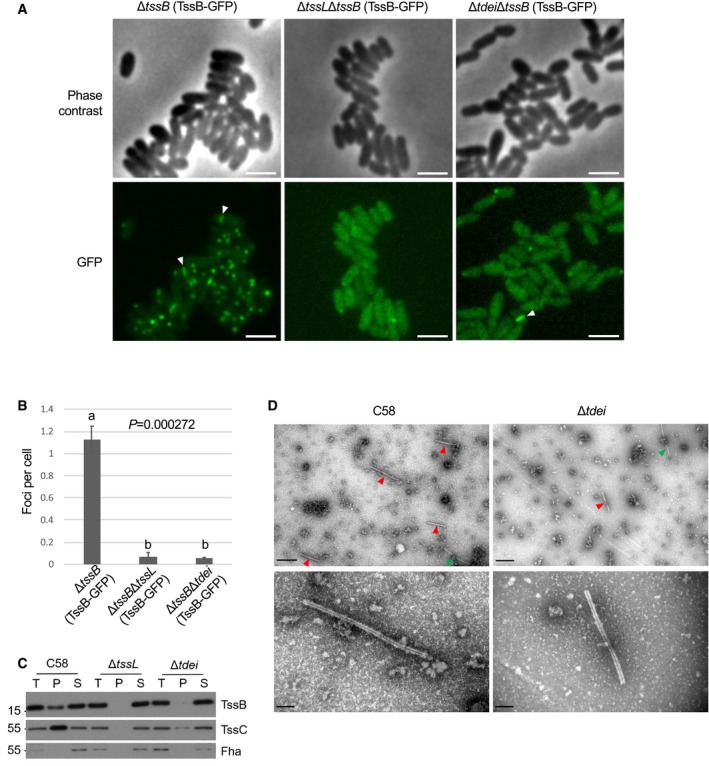
Figure 3. The presence of Tde effectors is required for efficient TssBC sheath assembly.

- Representative images of cells of Agrobacterium tumefaciens C58 strains ΔtssB, ΔtssLΔtssB, and ΔtdeiΔtssB cells each expressing TssB‐GFP from pTrc200. Upper panel: phase contrast images; lower panel: green fluorescence images. Examples of GFP streaks were indicated by white arrowheads. Scale bar: 2 μm.
- Quantification of TssB‐GFP foci in different genetic background. The number of the fluorescent foci was counted using the “analysis particle” function in Fiji with a manually set threshold. The number of cells was counted manually. For each strain, a total of three images were obtained from one independent experiment and each image contained more than 300 cells for quantification and statistical analysis. One‐way ANOVA followed by Turkey HSD test was used for statistical analysis. Data are mean ± SEM, and two groups with significant differences (P = 0.000272) are indicated with different letters (a and b). Similar results are reproduced in two independent experiments.
- Western blots of the isolated sheaths, which were prepared via ultracentrifugation of cell lysates from A. tumefaciens C58 wild‐type, ΔtssL, and Δtdei. T: total proteins from the cell lysate. P: pellet samples containing TssBC sheaths after ultracentrifugation. S: supernatant after ultracentrifugation. Proteins were analyzed in Western blots probed with indicated antibodies. Fha serves as a cytoplasmic control. Molecular weight markers (in kDa) are indicated on the left. Similar results were obtained from at least two independent experiments. Data are from one independent experiment and reproduced in at least two independent experiments.
- Pellet samples of wild type and Δtdei were visualized with transmission electron microscopy (TEM). Sheaths are indicated by red arrowheads, and flagella, which are distinguishable on the basis of smoother, more solid, and thinner structures (˜ 13 nm in width), are indicated by green arrowheads 33. Data are from one independent experiment and reproduced in at least two independent experiments. Scale bar: 0.5 μm (upper panel), 100 nm (upper panel).
Source data are available online for this figure.
