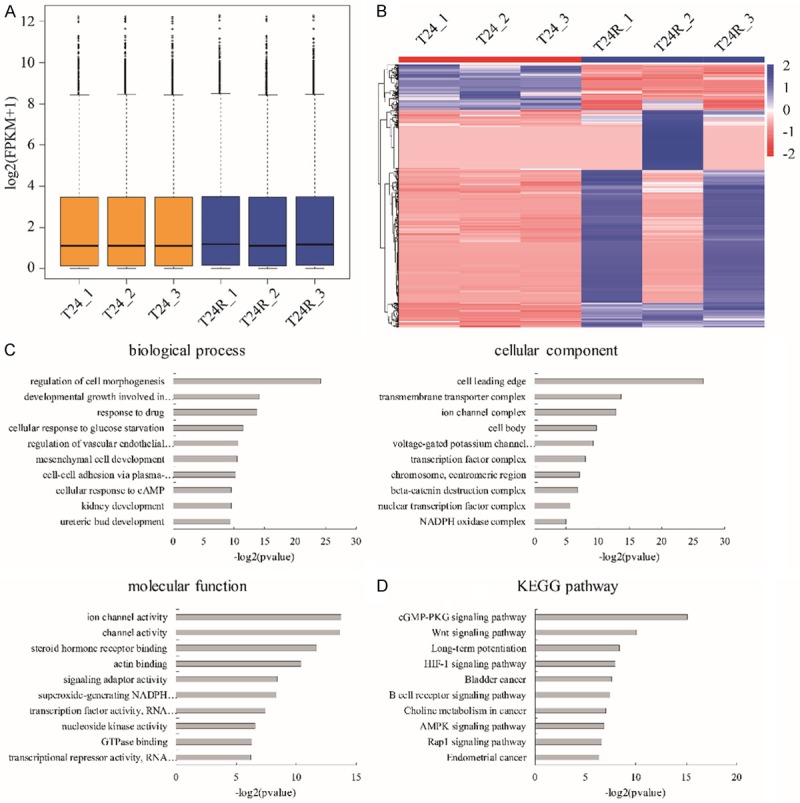
Figure 2.

RNA profiling of cisplatin-resistant T24 cells. (A) The FPKM distribution of RNA-seq data. (B) Heatmap of genes with differential expression between T24R and T24 cells. Color bars above the heatmap represent sample groups: red is for up-regulated genes and blue is for down-regulated genes. Gene ontology analysis including biological process, cellular component and molecular function (C) and KEGG analysis (D) of the top 10 function enrichments or pathways associated with these differentially expressed genes of T24R vs. T24 cells.
