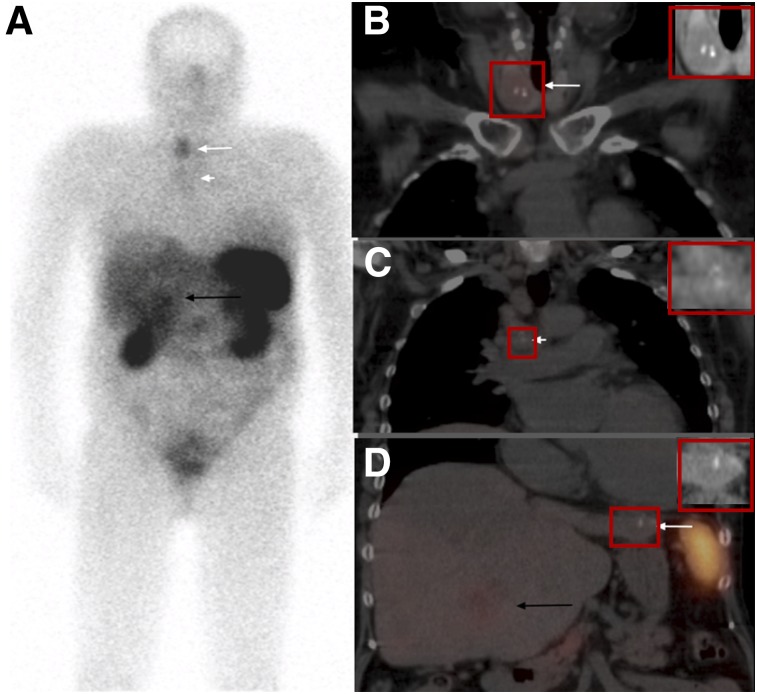
FIGURE 2.
111In-pentetreotide scan identifies focal uptake in thyroid nodule. (A) Whole-body images (anterior view) show uptake in right thyroid nodule (long white arrow), mild uptake in mediastinal lymph nodes (short white arrow), and heterogeneous liver uptake more prominent in segment-5 lesion (black arrow). (B–D) Fused coronal SPECT/CT images show focal thyroid uptake corresponding to a heterogeneous low attenuation thyroid nodule with dense, coarse calcifications within (arrow in B), mild uptake in mediastinal lymph nodes also containing dense calcifications (arrow in C), and heterogeneous liver uptake due to multiple liver lesions more prominent within one of the lesions in segment 5 (black arrow in D). Small calcification in left lobe of the liver lesion is also seen (white arrow on image D).

