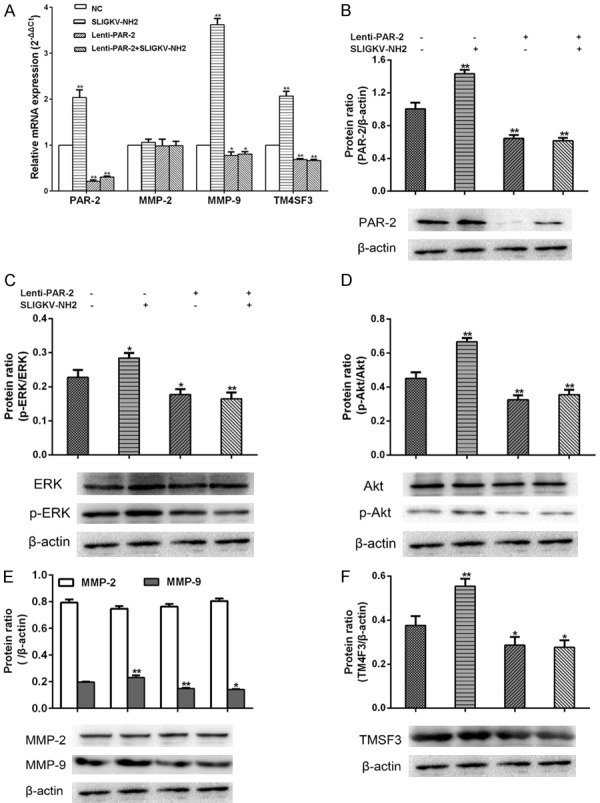
Figure 3.

Effects of PAR-2 on the mRNA and protein expression levels of cell invasion related molecules (x̅ ± s, n = 3). A. The relative mRNA expression levels of PAR-2, MMP-2, MMP-9, and TM4SF3. B-F. Protein expressions of PAR-2, MMP-2, MMP-9, TM4SF3, ERK, p-ERK, Akt, and p-Akt. *P < 0.05 vs blank group, **P < 0.01 vs blank group.
