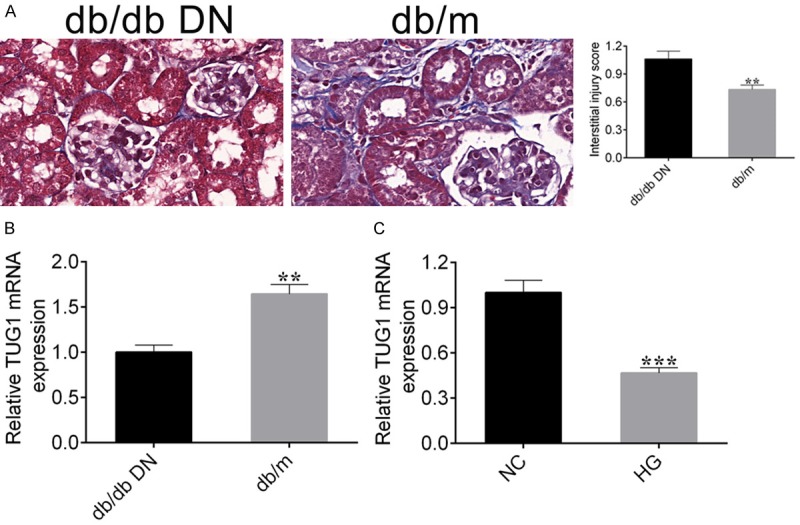
Figure 1.

LncRNA TUG1 is down-regulated in db/db DN mice kidney tissue and high glucose-stimulated NRK-52E cells. A. Masson staining was used to detect the degree of renal fibrosis between db/db DN and db/m mice (left panel), the extent of fibrosis is quantified by Image Pro Plus, Student’s t-test: ***P < 0.001 (right panel). B. qRT-PCR detected the expression level of lncRNA TUG1 mRNA in db/db DN and db/m mice. C. qRT-PCR was also carried out to detect the expression level of lncRNA TUG1 in high glucose-stimulated NRK-52E cells. Student’s t-test: ***P < 0.001.
