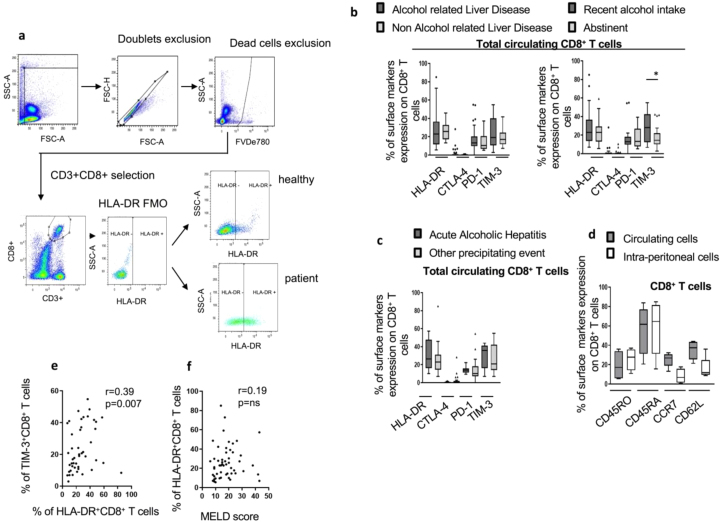
Fig. S1.
CD8+ T cells phenotyping using flow cytometry. (a) Gating/ cell sorting strategy to determine CD3+CD8+ T cells phenotype in cirrhotic patients and HV: frozen isolated PBMCs or AMNCs were thawed, stained by Fluorescence Viability Dye (FVD) and finally extra- or intra-cellular stained. Following doublets and live/dead exclusion, CD3/CD8 double positive cells were selected. The expression of extracellular or intracellular markers was then assessed on the CD3+CD8+ subset using Fluorescence Minus One (FMO) controls; (b) Phenotype of circulating CD8+ T cells in the entire cohort of cirrhotic patients according to history of alcohol consumption: total CD8+ T cells phenotype in patients with alcohol related liver disease (ALD) (n = 47) versus non-ALD patients (n = 13) (left panel) and in abstinent (n = 32) versus non-abstinent patients (n = 28) (right panel). (c) Phenotype of total circulating CD8+ T cells in AD patients according to the precipitating event: acute alcoholic hepatitis (AAH) (n = 10) versus other (n = 25). (d) Expression of maturation surface markers in peritoneal CD8+ T cells compared to paired circulating CD8+ T cells in cirrhotic patients (n = 7). (e) Correlations between TIM-3+CD8+ T cells and HLA-DR+CD8+ T cells (Spearman correlation; n = 46). (f) No correlations were detected between HLA-DR expression on CD8+ T cells and MELD score (n = 53)* p<0.05; ** p<0.0001 (Mann-Whitney U test (b;c); Wilcoxon signed-rank test (d); Spearman correlation (e;f)).

