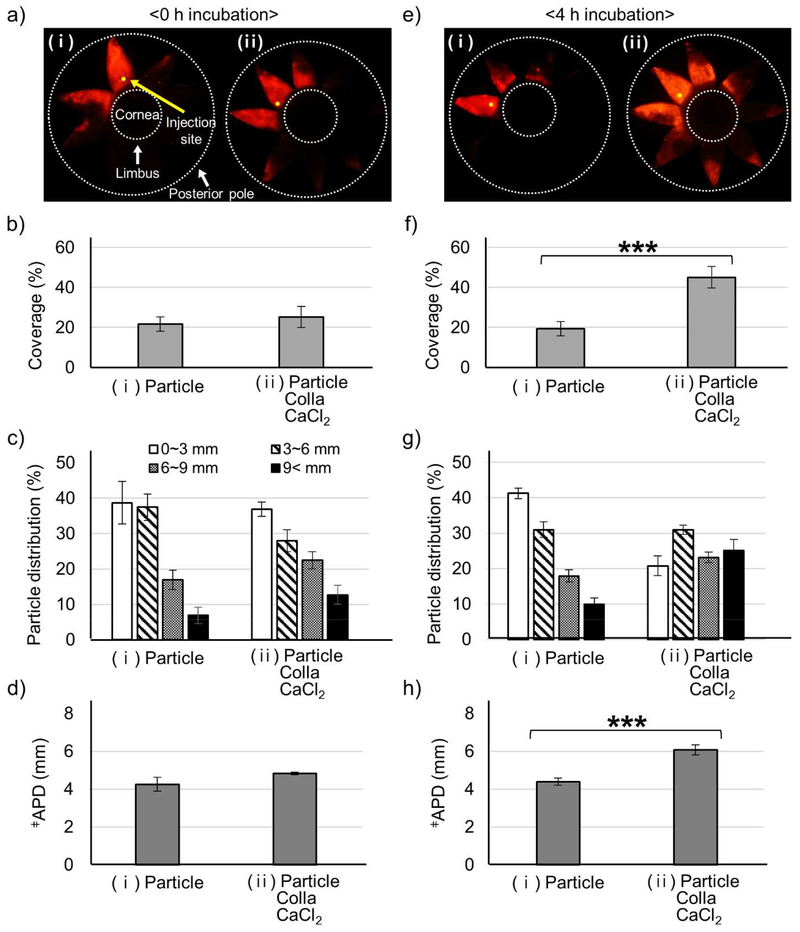
Figure 1.
Microparticle delivery in SCS enhanced by collagenase formulation. Microparticles (Particle) were delivered alone (i) or with collagenase (Colla) and CaCl2 (ii) to the SCS of rabbit eyes ex vivo. Imaging and analysis were performed immediately (a-d) or following incubation at 37 °C for 4 h (e-h) after injection. Representative fluorescence micrographs (a, e), particle delivery coverage (i.e., percent of SCS containing microparticles) (b, f), particle distribution in the SCS (expressed as distance posteriorly from the limbus) (c, g), and average particle delivery distance (APD, expressed as the average particle distance posteriorly from the limbus) (d, h) of red-fluorescent microparticles in the SCS. Fluorescence micrographs (a, e) show splayed eyes after dissection with 8 radial cuts from the posterior pole to the limbus to form “eye petals.” Yellow dots identify the SCS injection site. The cornea is located in the center of the petals, and the posterior pole is at the tips of the petals. Two white dashed lines indicate the location of the limbus and the posterior pole. APD (d, h) was calculated based on the particle distribution in (c, g). ǂAPD (mm) = (1.5 mm × % of particles in 0-3 mm region) + (4.5 mm × % of particles in 3-6 mm region) + (7.5 mm × % of particles in 6-9 mm region) + (10.5 mm × % of particles in >9 mm region). *** indicates significant difference (one tailed t-test, p<0.005). Graphs show mean ± SEM (n=3 in (a-d) and n=6 in (e-f)).

