
Figure 1.
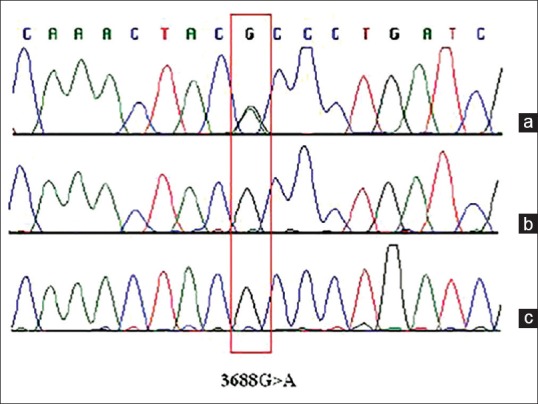
Molecular analysis of the ND1 gene in an acute lymphoblastic leukemia patient. This electropherograms of the ND1 gene show the 3688G>A transition only in a bone marrow sample collected at the time of leukemia diagnosis: (a) DNA isolated from bone marrow cells collected from the patient at the time of diagnosis. (b) DNA isolated from bone marrow cells collected from the patient at day 42 of treatment. (c) DNA isolated from the patient's blood. (Figure retrieved from the article of Kodroń et al.,[13] after permission for use)