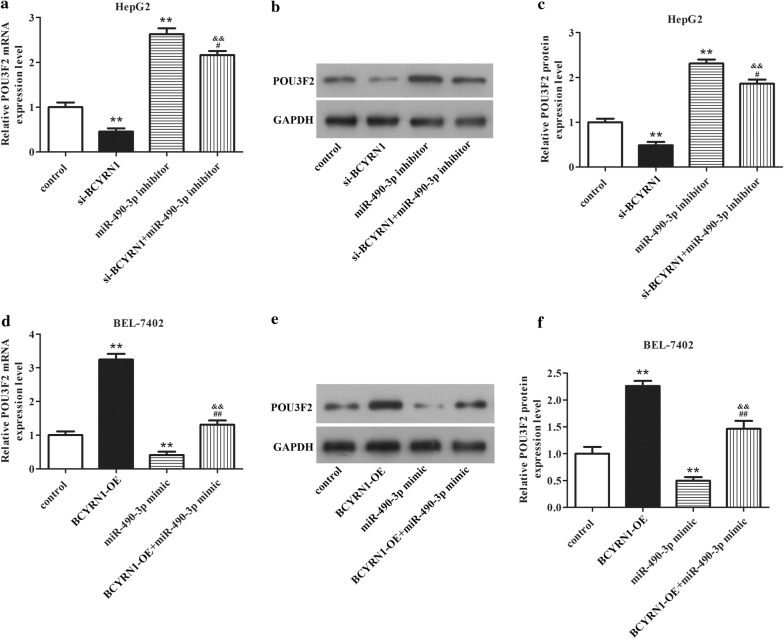
Fig. 5.
Associations among BCYRN1, miR-490-3p, and POU3F2 were assessed by western blot and qRT-PCR. The mRNA a and protein b expression of POU3F2 in HepG2 cells were evaluated after knockdown of BCYRN1, miR-490-3p, or BCYRN1 + miR-490-3p. c is statistical of b. **P < 0.01 vs. control, #P < 0.01 vs. miR-490-3p inhibitor. The mRNA d and protein e expression of POU3F2 in BEL-7402 cells were determined after overexpression of BCYRN1, miR-490-3p, or BCYRN1 + miR-490-3p. f is statistical of e. **P < 0.01 vs. control, ##P < 0.01 vs. miR-490-3p mimic

