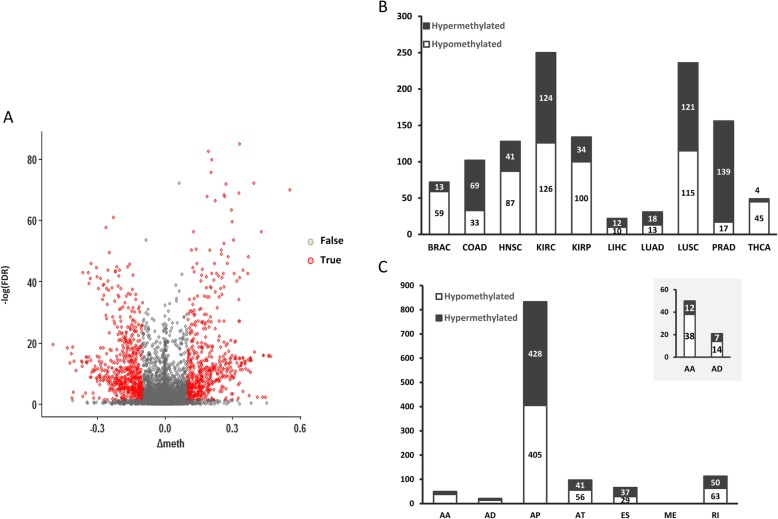
Fig. 3.
Differentially methylated CpGs at alternatively spliced exon boundaries in multiple tumors. a Volcano plot showing a comparison of the methylation level of CpGs for tumor tissues versus adjacent normal tissues. This plot depicts the biological significance (|△meth|) ≥ 10%) on the X axis and the statistical significance (−log10 FDR) on the Y axis. b The proportion of hypomethylated and hypermethylated CpGs at cancer-specific alternative spliced exon boundaries in different tumors. c The proportion of hypomethylated and hypermethylated CpGs at cancer-specific alternative spliced exon boundaries in different splicing types

