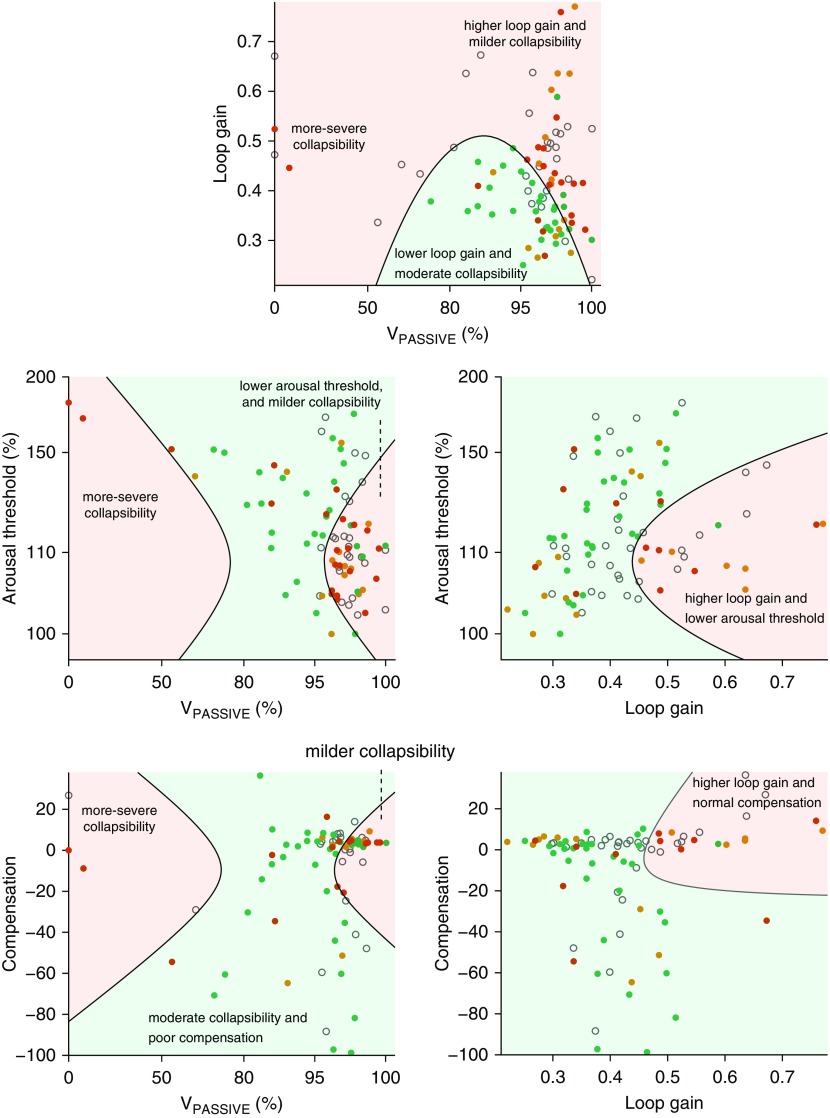
Figure 1.
Key aspects of the five-trait multivariable model (see Table 2) illustrating how combinations of traits may influence oral appliance efficacy. Each plot depicts a two-trait cross-section of the full model drawn at the mean values of the remaining three traits. Dots represent true response observations of individual patients: red for nonresponders (<50% reduction in apnea–hypopnea index [AHI] with treatment), orange and green for responders (50–70% reduction in AHI and >70% reduction in AHI, respectively). Background regions represent predicted response subgroups (light green for predicted responders and light red for predicted nonresponders). Top and left: A U-shaped relationship between collapsibility (VPASSIVE) and efficacy is evident. For example, in the top figure, the light green shading indicating predicted responders is only seen in a midrange of moderate collapsibility and at lower loop gain. Note that nonresponders with high VPASSIVE (mild collapsibility) tend to have high loop gain, low arousal threshold, and higher compensation (see dense regions of red dots). Top and right: A higher loop gain is associated with reduced treatment efficacy, particularly in milder collapsibility (high VPASSIVE), but also in the presence of a lower arousal threshold and higher compensation. Open gray circles on each plot represent individual patients whose values for the three remaining traits were too far from the mean to be fairly represented in the simplified two-trait view (i.e., two-trait prediction differed from the full model prediction).

