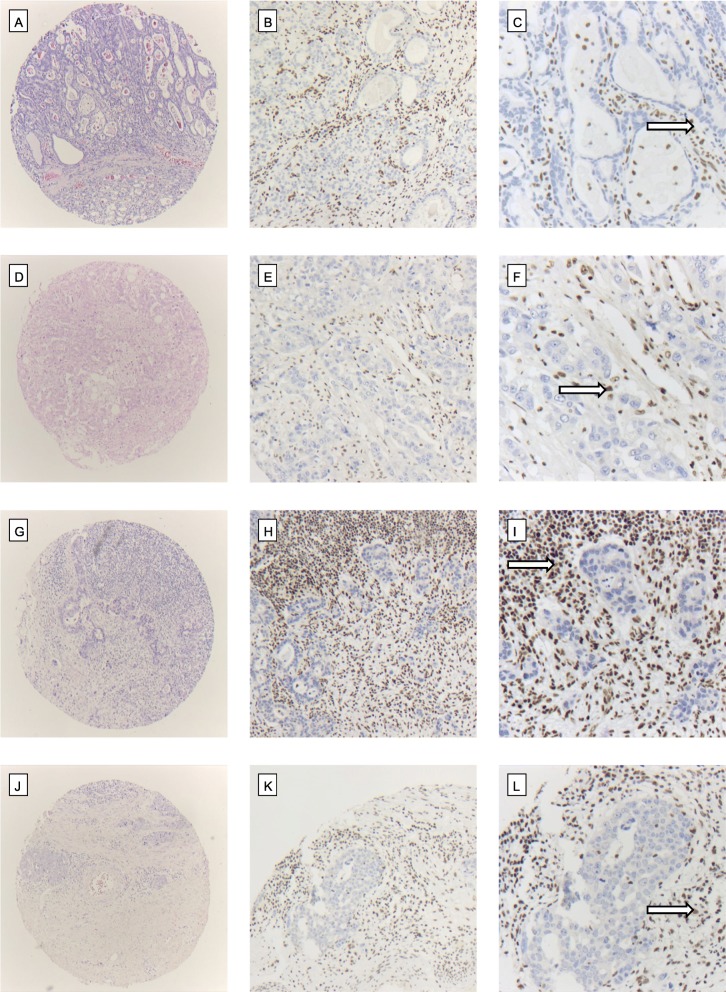
Fig. 2.
Protein-loss of ARID1a, BRM, BRG1 and INI1 in EAC. Top line: (a) EAC (HE, × 5) with loss of ARID1a expression (b) (IHC, × 10), (c) (IHC, × 20). Second line: (d) EAC (HE, × 5) with loss of BRM (e) (IHC, × 10), (f) (IHC, × 20). Third line: (g) EAC (HE, × 5) with loss of BRG1 (h) (IHC, × 10), (i) (IHC, × 20). Bottom line: (j) EAC (HE, × 5) with loss of INI1 (k) (IHC, × 10), (l) (IHC, × 20). Strong nuclear staining of the surrounding non-tumor cells served as internal control (arrow)

