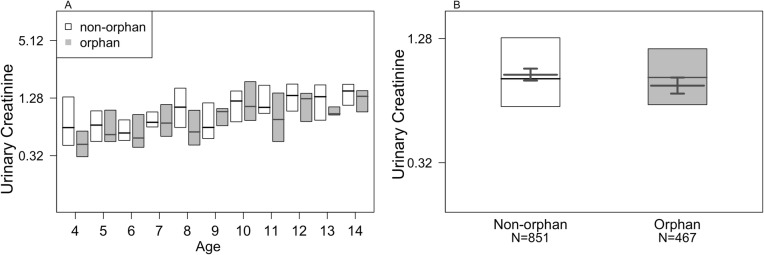
Fig. 1.
The effect of maternal presence on creatinine levels (mg/ml) of offspring between the ages of 4–15 years (n = 1318 samples). The figure panels depict the data by a age and orphan status or B) orphan status alone. In both panels the thin black horizontal lines represent medians and the white (non-orphan) and grey (orphan) boxes represent quartiles. In b, the thick black lines represent the fitted model values and the black error bars its 95% confidence intervals

