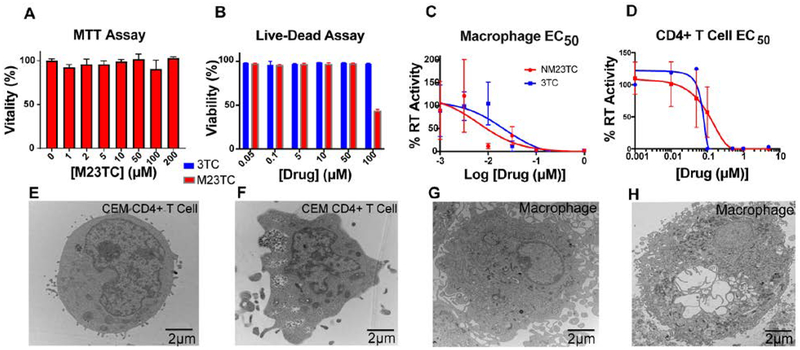
Figure 2. Physicochemical and biological characterization of M23TC and NM23TC.
(A) MTT assay of MDM 24 h after M23TC treatment over a concentration range of 1–200μM. Results were normalized to untreated control MDM. M23TC was found to be nontoxic up to 200 μM. Data are represented as mean +/− SEM for n=3 samples per group. (B) CEM CD4+ T cell vitality using LiveDead Staining. CEM CD4+ T cells plated in a 96 well plate at 100,000 cells/well were treated with a ranged of 3TC or M23TC concentrations from 0.05–100μM. Data are represented as mean +/− SEM for n=3 samples per group. (C) EC50 was determined in MDM by measuring RT activity in the supernatant for 3TC and NM3TC over a concentration range of 1nM-1μM (EC50=6.2 nM for NM23TC, 19.4 nM for 3TC). (D) EC50 was measured in CD4+ T cells over a concentration range of 1nM-10μM by measuring RT activity of supernatant and normalized to % of positive control (EC50=79.7 nM for NM23TC, 35.4 nM for 3TC). (E-H) TEM morphological evaluation in MDM and CEM-CD4+ T CD4+ T cells. Cells were treated with 100μM NM23TC for 8 hours. Control cells (E and G) were given no treatment and collected alongside treated cells (F and H).

