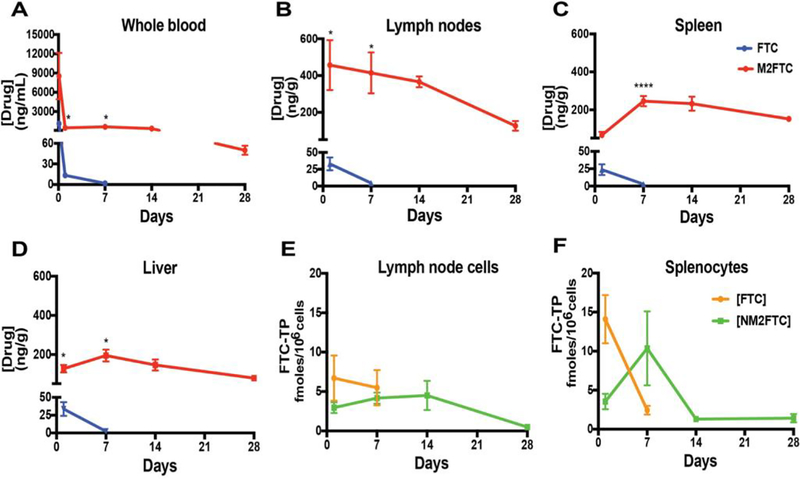
Fig. 5. PK and biodistribution of FTC and NM2FTC in rats.
Blood and tissue M2FTC and FTC concentrations were determined over 28 days. A) FTC and M2FTC levels in whole blood after a single IM injection of FTC or NM2FTC in Sprague Dawley rats (45 mg/kg FTC equivalents). M2FTC and FTC concentrations were determined in (B) lymph nodes, (C) spleen, and (D) liver. Data are expressed as mean ± SEM for n = 5 rats per group. Formation of FTC-TP in (E) lymph node and (F) spleen cells were determined. Drug concentrations were quantified by UPLC-MS/MS.

