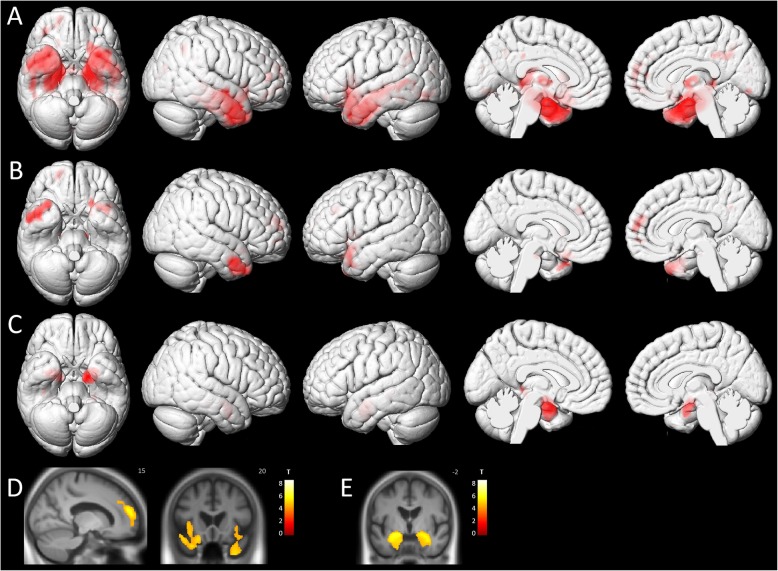
Fig. 2.
Patterns of significant voxel-wise gray matter loss in the three groups. a AD patients compared to controls, b DLB patients compared to controls, and c AD patients compared to DLB patients, superimposed on three-dimensional MNI surface renders. d DLB patients compared to controls and e AD patients compared to DLB patients, superimposed on a mean T1 image (neurological orientation). All results are represented at p < 0.001 (FDR-corrected) at the voxel level

