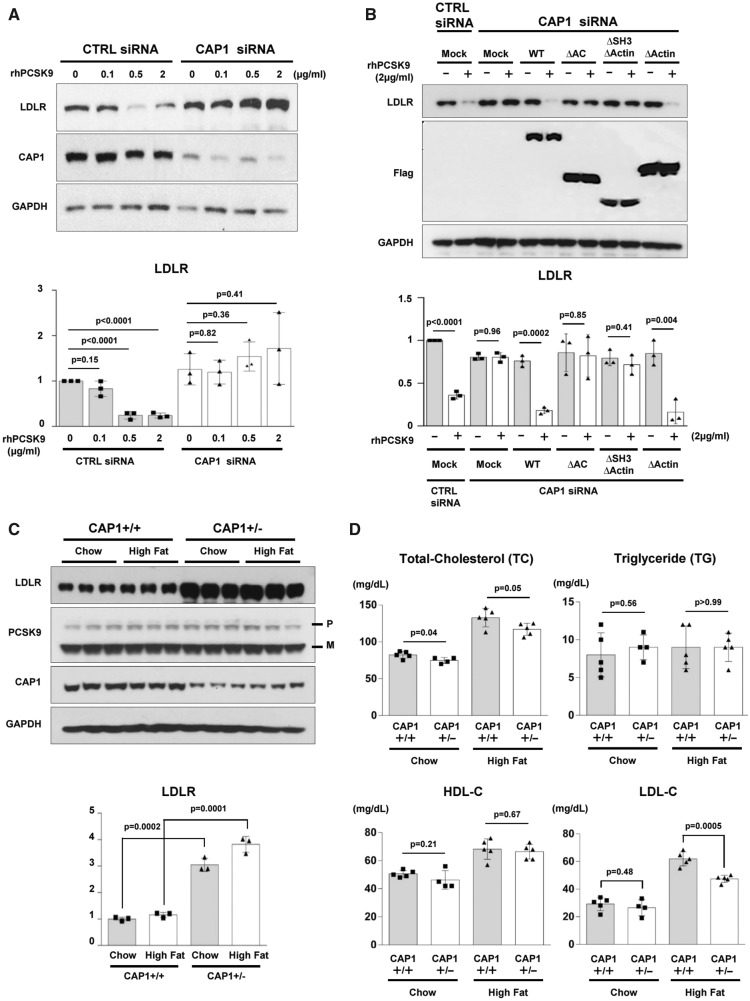
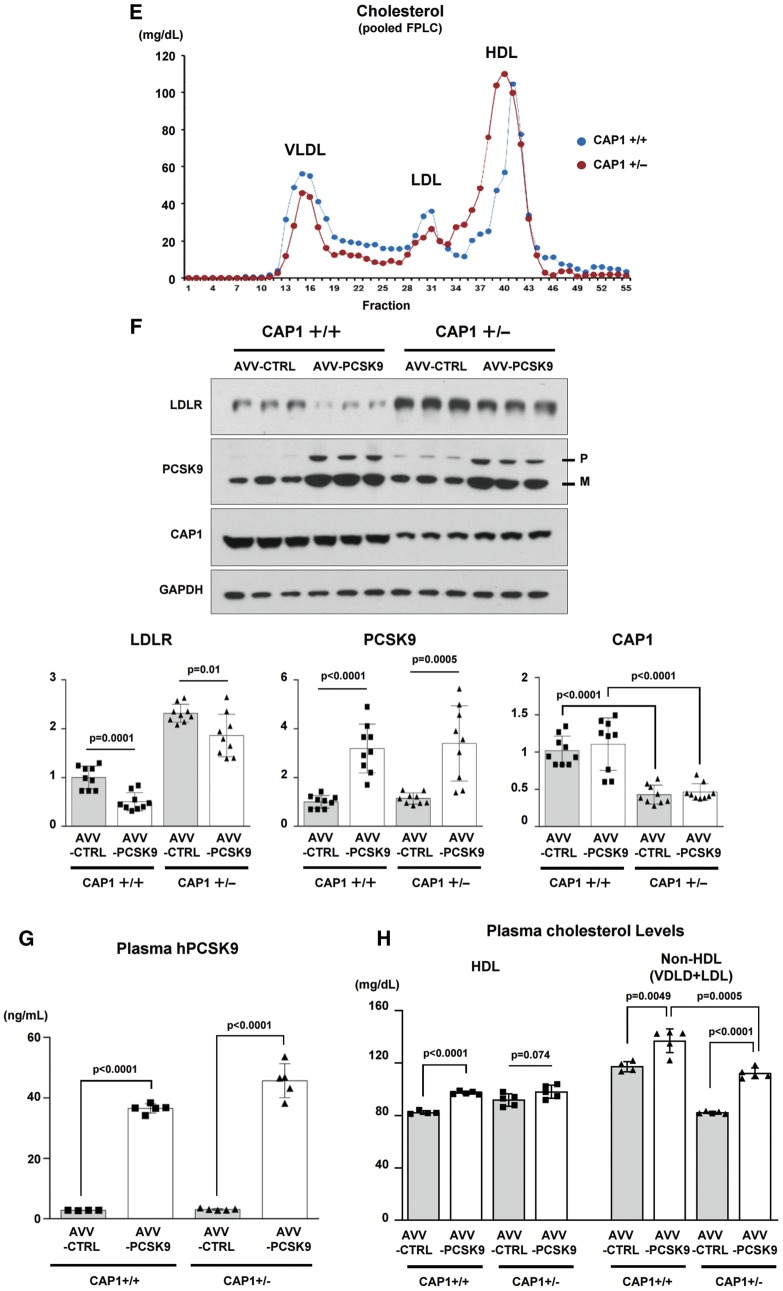
Figure 3.
CAP1 is required for PCSK9-induced LDLR degradation. (A) LDLR degradation induced by PCSK9 was attenuated by CAP1 siRNA (upper panel). The representative figure of three independent experiments. Quantification of the expression levels of LDLR (bottom panel). (B) PCSK9-induced LDLR degradation was rescued by wild-type CAP1 and the ▵ACBD mutant (upper panel). Quantification of the expression levels of LDLR (bottom panel). (C) The protein expression levels of LDLR were significantly greater in the CAP1+/− mice than those in the CAP1+/+ mice, regardless of the diet. Pro-PCSK9 (P) and mature PCSK9 (M) are indicated with bold line. Quantification of the expression levels of LDLR/GAPDH in CAP1+/− vs. CAP1+/+ mice (bottom panel). (D) Enzymatic measurement of the plasma cholesterol levels in CAP1+/− and CAP1+/+ mice fed either high fat- or chow diet for 16 weeks (n = 6 per group). (E) Cholesterol levels in FPLC fractions from pooled plasma samples (n = 5 per group) in CAP+/− (red) and CAP1+/+ (blue) mice fed high-fat diet. (F–H) Overexpression of PCSK9 in both CAP1+/− and CAP1+/+ mice using adeno-associated virus. (F) Immunoblot analysis of PCSK9-induced LDLR degradation in CAP1+/− and CAP1+/+ mice liver. Pro-PCSK9 (P) and mature PCSK9 (M) are indicated with bold line. The representative figure of three independent experiments. Quantification of the expression levels of LDLR (bottom left), PCSK9 (bottom middle), and CAP1 (bottom right) (n = 9). (G) Plasma levels of hPCSK9 were measured by ELISA (n = 5 per group). (H) Enzymatic analysis of plasma cholesterol levels in CAP1+/− and CAP1+/+ mice with or without PCSK9 overexpression (n = 5 per group).


