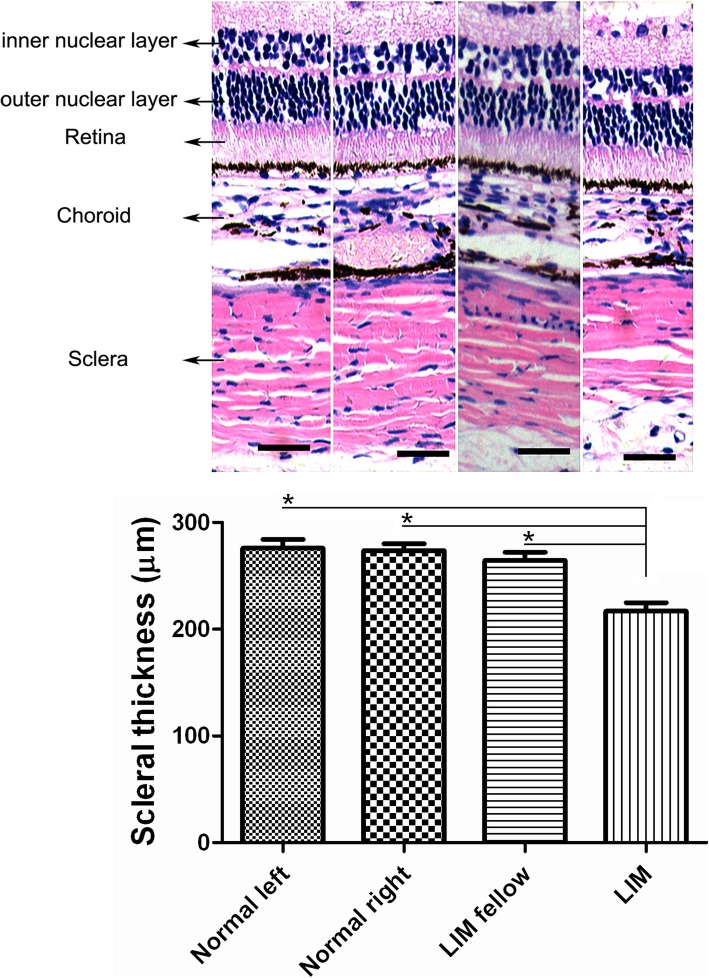
Fig. 1.
Alterations of the thickness of posterior sclera in normal control and NLIM guinea pigs. Quantitative analysis of the scleral thickness in both control and NLIM groups were performed (n = 6 for each group) and statistical analysis was done (lower). a = normal left eye, b = normal right eye, c = NLIM fellow eye, and d = NLIM eye. Bar = 100 μm. *P < 0.01

