Fig. 5.
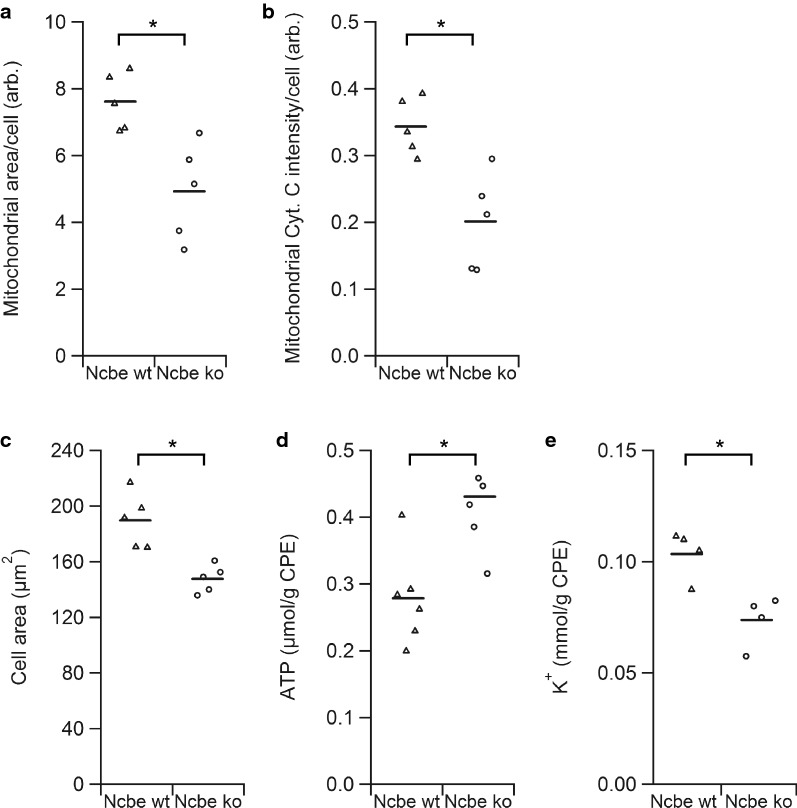
Evaluation of mitochondrial abundance, cell size, ATP, and K+ levels. a Scatter plot comparing the average mitochondrial area determined by the cytochrome C positive area within cells from Ncbe wt and Ncbe ko CP (*p < 0.05, n = 5, representing 364 Ncbe wt cells and 482 Ncbe ko cells). Mean values indicated by horizontal bars. Triangles indicate data points from Ncbe wt CP, whereas circles represent data from Ncbe ko CP. b The mean cytochrome C immunostaining intensity per cell from the Ncbe wt and Ncbe ko CP epithelium, respectively (*p < 0.05, n = 5, representing 364 Ncbe wt cells and 482 Ncbe ko cells). Mean values indicated by horizontal bars. Triangles indicate data points from Ncbe wt CP, whereas circles represent data from Ncbe ko CP. c Estimation of the average cell size in Ncbe wt and Ncbe ko CP epithelium from micrographs of background fluorescence (*p < 0.05, n = 5, representing 1214 Ncbe wt cells and 1222 Ncbe ko cells). Mean values indicated by horizontal bars. Triangles indicate data points from Ncbe wt CP, whereas circles represent data from Ncbe ko CP. d Scatter plot showing the mean ATP levels in the CP from Ncbe wt and Ncbe ko mice by chemiluminescence (*p < 0.05, n = 6). Mean values indicated by horizontal bars. Triangles indicate data points from Ncbe wt CP, whereas circles represent data from Ncbe ko CP. e Estimation of the mean cellular K+ content in the CP from Ncbe wt and Ncbe ko mice by flame photometry (*p < 0.05, n = 4). Mean values indicated by horizontal bars. Triangles indicate data points from Ncbe wt CP, whereas circles represent data from Ncbe ko CP

