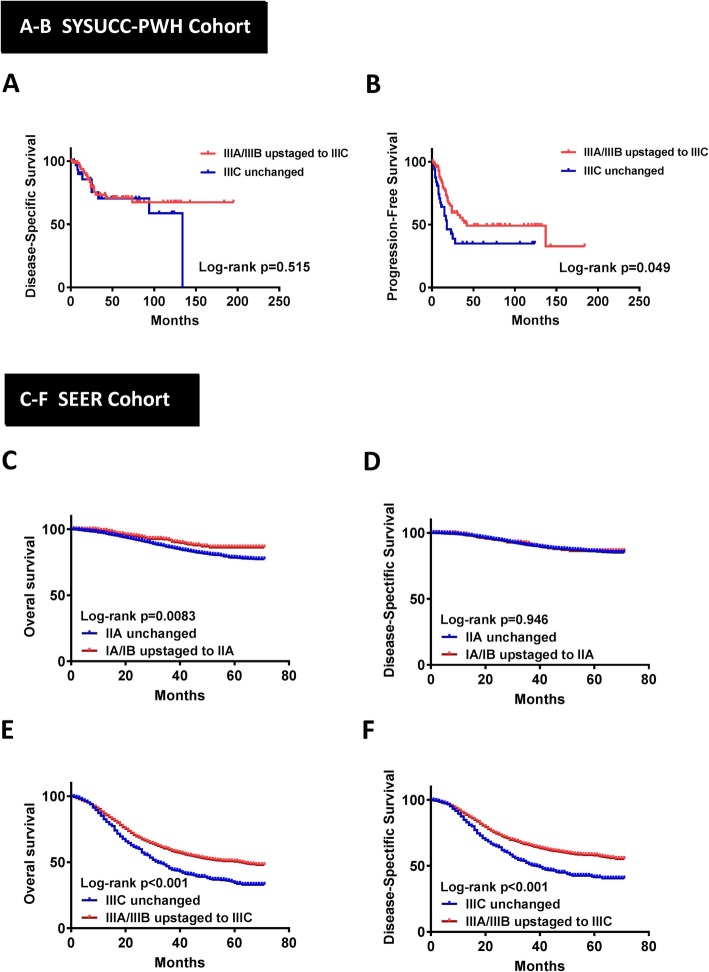
Fig. 2.
Kaplan-Meier curves of DSS (a) and PFS (b) for the SYSUCC-PWH cohort between patients with IIIC unchanged and those with anatomical stage IIIA/IIIB upstaged to prognostic stage IIIC. Kaplan-Meier curves of OS (c) and DSS (d) for the SEER cohort between patients with IIA unchanged and those with anatomical stage IA/IB upstaged to prognostic stage IIA; Kaplan-Meier curves of OS (e) and DSS (f) for the SEER cohort between patients with IIIC unchanged and those with anatomical stage IIIA/IIIB upstaged to prognostic stage IIIC

