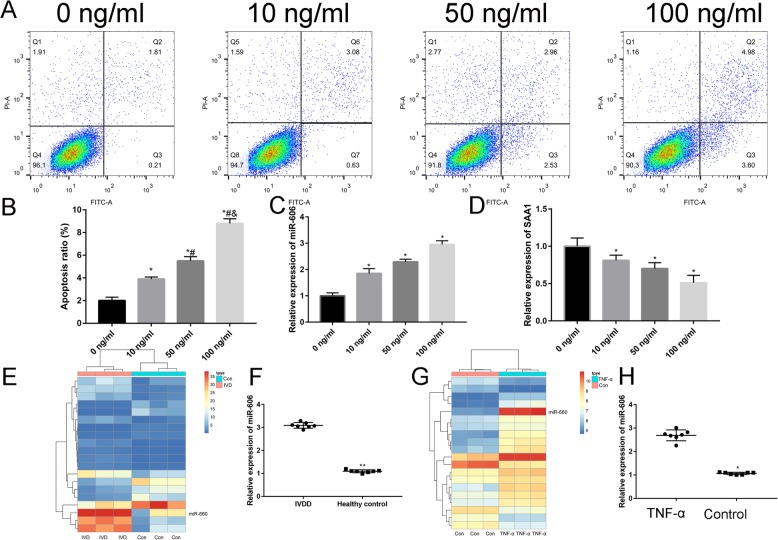
Fig. 2.
a Effect of TNF-α on nucleus pulposus cells apoptosis. TNF-α-induced apoptosis in concentration (0 ng/ml, 10 ng/ml, 50 ng/ml, and 100 ng/ml) at 12 h (*p < 0.05); b the percentages of apoptotic cells for all groups; c Relative expression of miR-660 in different concentration of TNF-α groups (0 ng/ml, 10 ng/ml, 50 ng/ml, and 100 ng/ml). d Relative expression of SAA1 in different concentration of TNF-α groups (0 ng/ml, 10 ng/ml, 50 ng/ml, and 100 ng/ml); e heatmap of differentially expressed genes in IVDD and healthy controls; f PCR result to identify the relative expression of miR-660 in IVDD and healthy control; g heatmap of differentially expressed genes in TNF-α and control group; h PCR result to identify the relative expression of miR-660 in TNF-α and control group

