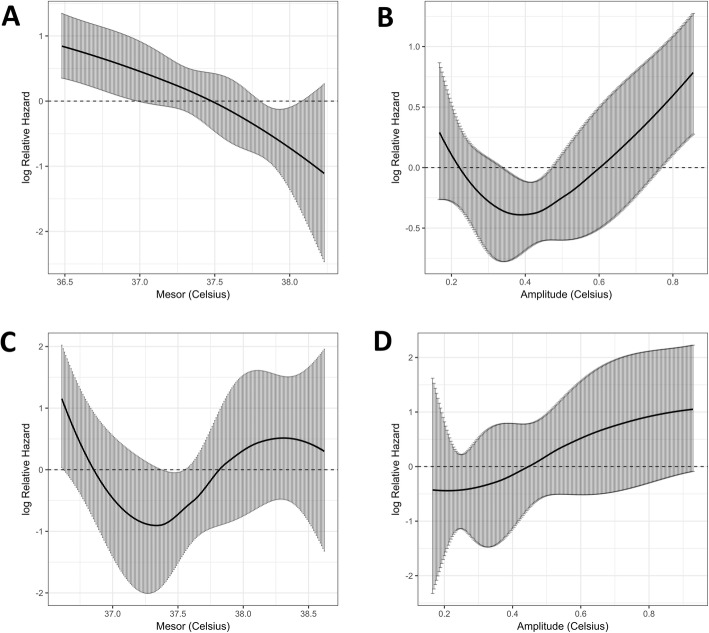
Fig. 5.
Cox regression model fitting the association between temperature and the log relative hazard of 28-day mortality according to head trauma. a Mesor in head trauma group. b Amplitude in head trauma group. c Mesor in non-head trauma group. d Amplitude in non-head trauma group. Black curve represents the estimates of the model and gray bars represent the 95% confidence interval bands

