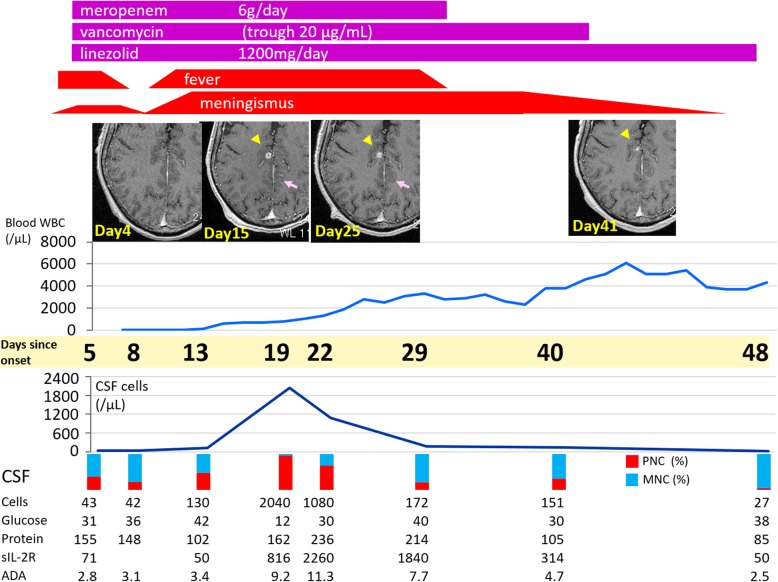
Fig. 1.
Clinical course. The figure indicates the clinical course of the patient from day 5 to day 48, when clinical symptoms resolved. The line plot shows the trend in blood leukocytes (above) and CSF cells (below). The vertical rectangle indicates the percentage of polymorphonuclear cells (red) in the CSF. On day 5, CSF showed moderate pleocytosis, with conspicuous protein increase. Antibiotic therapy was effective, leading to defervescence and neurological improvement. On day 13, however, fever and nuchal rigidity worsened. CSF findings showed 130 cells/μL with an increased proportion of polymorphonuclear cells. The MRI findings on day 15 revealed abscess lesions (arrow heads) and meningeal thickening (arrows). On day 19, meningism worsened remarkably, and CSF cells peaked at 2040 cells/μL with 98% polymorphonuclear cells. Other causes were ruled out, and meropenem, vancomycin, and linezolid were continued. Gradually, MRI and CSF findings improved and the patient was discharged without sequelae. Note that the inflammatory findings, such as CSF cells, sIL-2R, and ADA were dramatically enhanced in response to the recovery of blood leukocyte count. The reference ranges are; Blood leukocytes 3000-8000/μL, CSF cells 0–5/μL, CSF protein 10–40 mg/dL, CSF glucose 50–80 mg/dL, and CSF sIL-2R, <50 U/mL

