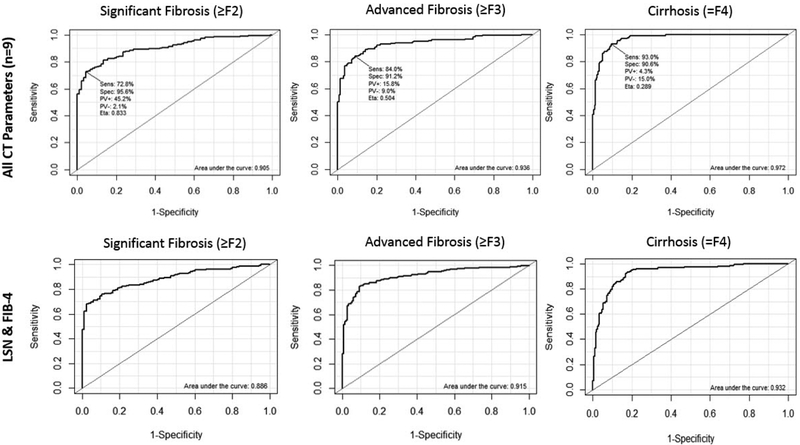
Figure 2. ROC curves from the multi-parametric analysis for all CT input variables and for LSN/FIB-4 combination, according to significant fibrosis (≥F2), advanced fibrosis (≥F3), and cirrhosis (=F4).
Top Row: ROC curves for predicting fibrosis using all 9 CT parameters. AUC values for significant fibrosis, advanced fibrosis, and cirrhosis were 0.905, 0.936, and 0.972, respectively.
Bottom Row: ROC AUC values for the limited combination of LSN score and FIB-4 were 0.886, 0.915, and 0.932, respectively. Only mild drop off in performance is seen, despite using only two complementary parameters (one CT value and one lab value).

