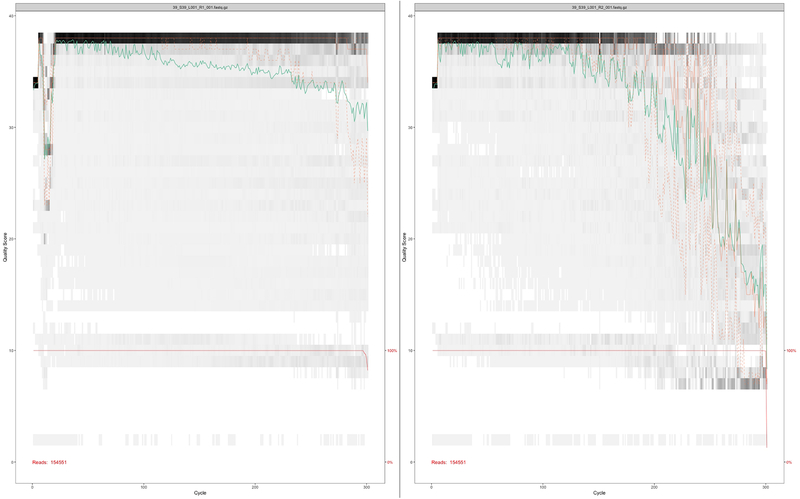
Figure 3: Quality profile of forward reads (R1, top) for two representative samples and corresponding reverse reads (R2, bottom) for the same samples.
The analysis was performed using a DADA2 pipeline, in which the x-axis shows read length (0–300 bases) and y-axis shows quality of the reads. Green line represents the median quality score, whereas the orange line represents quartiles of the quality score distribution at each base position. Forward reads (R1) always showed better quality than reverse reads (R2).

