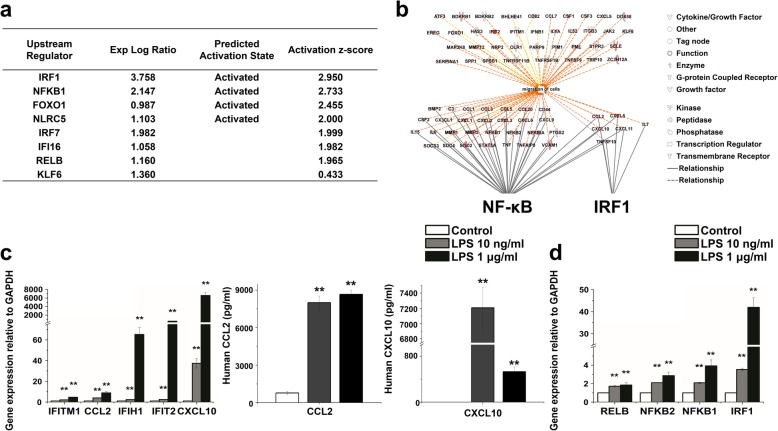
Fig. 2.
Transcriptomic analysis of TFs in LPS-treated hMSCs. a Upstream regulator analysis predicted the activation state of TFs including IRF1, NF-κB, FOXO1, and NLRC5 in LPS-treated hMSCs. b The migration-related molecules were highly correlated with NF-κB and IRF1. These molecules are presented using the IPA molecule activity predictor. c Confirmation of the expression levels of the cell migration-related genes using quantitative real-time PCR (left). Gene expression was normalized to GAPDH transcript levels. ELISA results showing the release of CCL2 and CXCL10 upon TLR4 stimulation of hMSCs (right). The data represent three independent experiments. **P < 0.005. d Confirmation of the expression levels of TFs NF-κB complex and IRF1 using quantitative real-time PCR

